Explore the Dashboard
Prerequisites
Before we begin, make sure you have our browser extension installed. You can install it here or get it from the Chrome Web Store, Firefox Add-ons, or Microsoft Edge Add-ons.
Introduction
Hey, Marius here, founder of Web Highlights. In this tutorial, I want to walk you through the dashboard and app view — your personal command center for everything you've saved, including pages, highlights, notes, tags, and more.
The dashboard is built directly into the extension. You don't need a separate web app. You don't need to sign up. Just click and browse. Whether you've saved 10 highlights or 10,000, the dashboard gives you instant access to all of it — with advanced filters, multiple view modes, and powerful sorting.
Let me show you how it works, step by step.
Opening the Dashboard
There are two ways to open the dashboard:
From the Extension Sidebar
- Click the Web Highlights icon in your browser toolbar to open the sidebar.
- Click the Expand button at the top of the sidebar. This opens the full app view.
- You'll land directly on the dashboard.
Keyboard Shortcut
You can also configure a keyboard shortcut to open the dashboard instantly without clicking anything.
From the Web App
If you have a Web Highlights account, you can also open the dashboard at app.web-highlights.com. The web app syncs with your extension data, so everything stays in sync across devices.
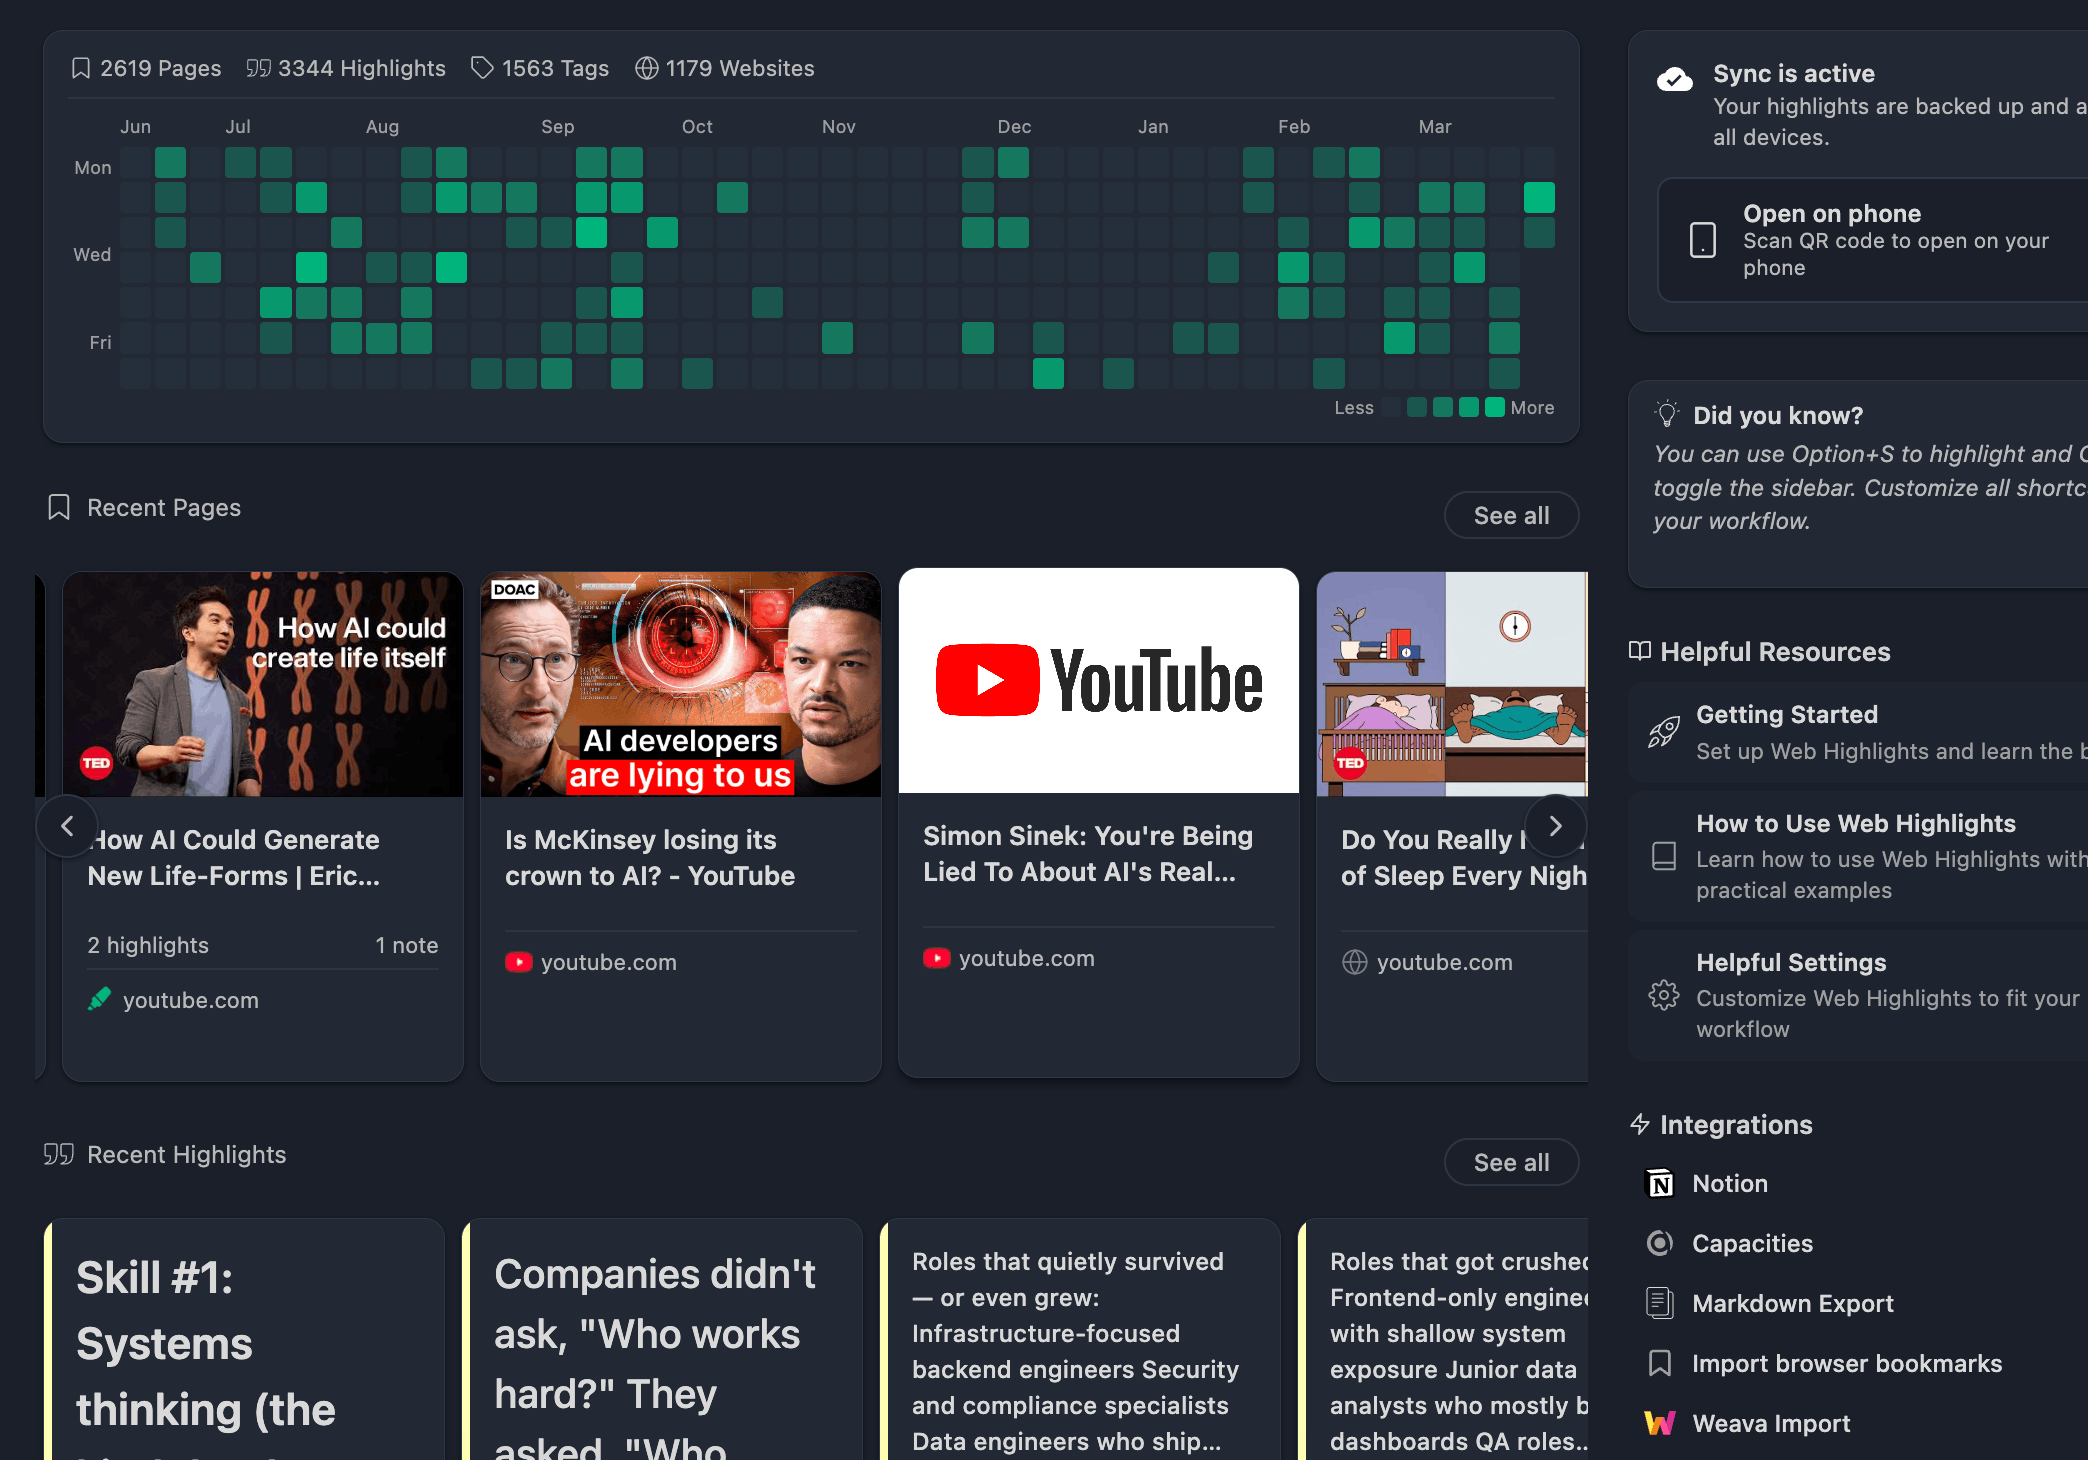
The Dashboard at a Glance
When the dashboard loads, you'll see an overview of your entire library. Think of it as the home screen for your research.
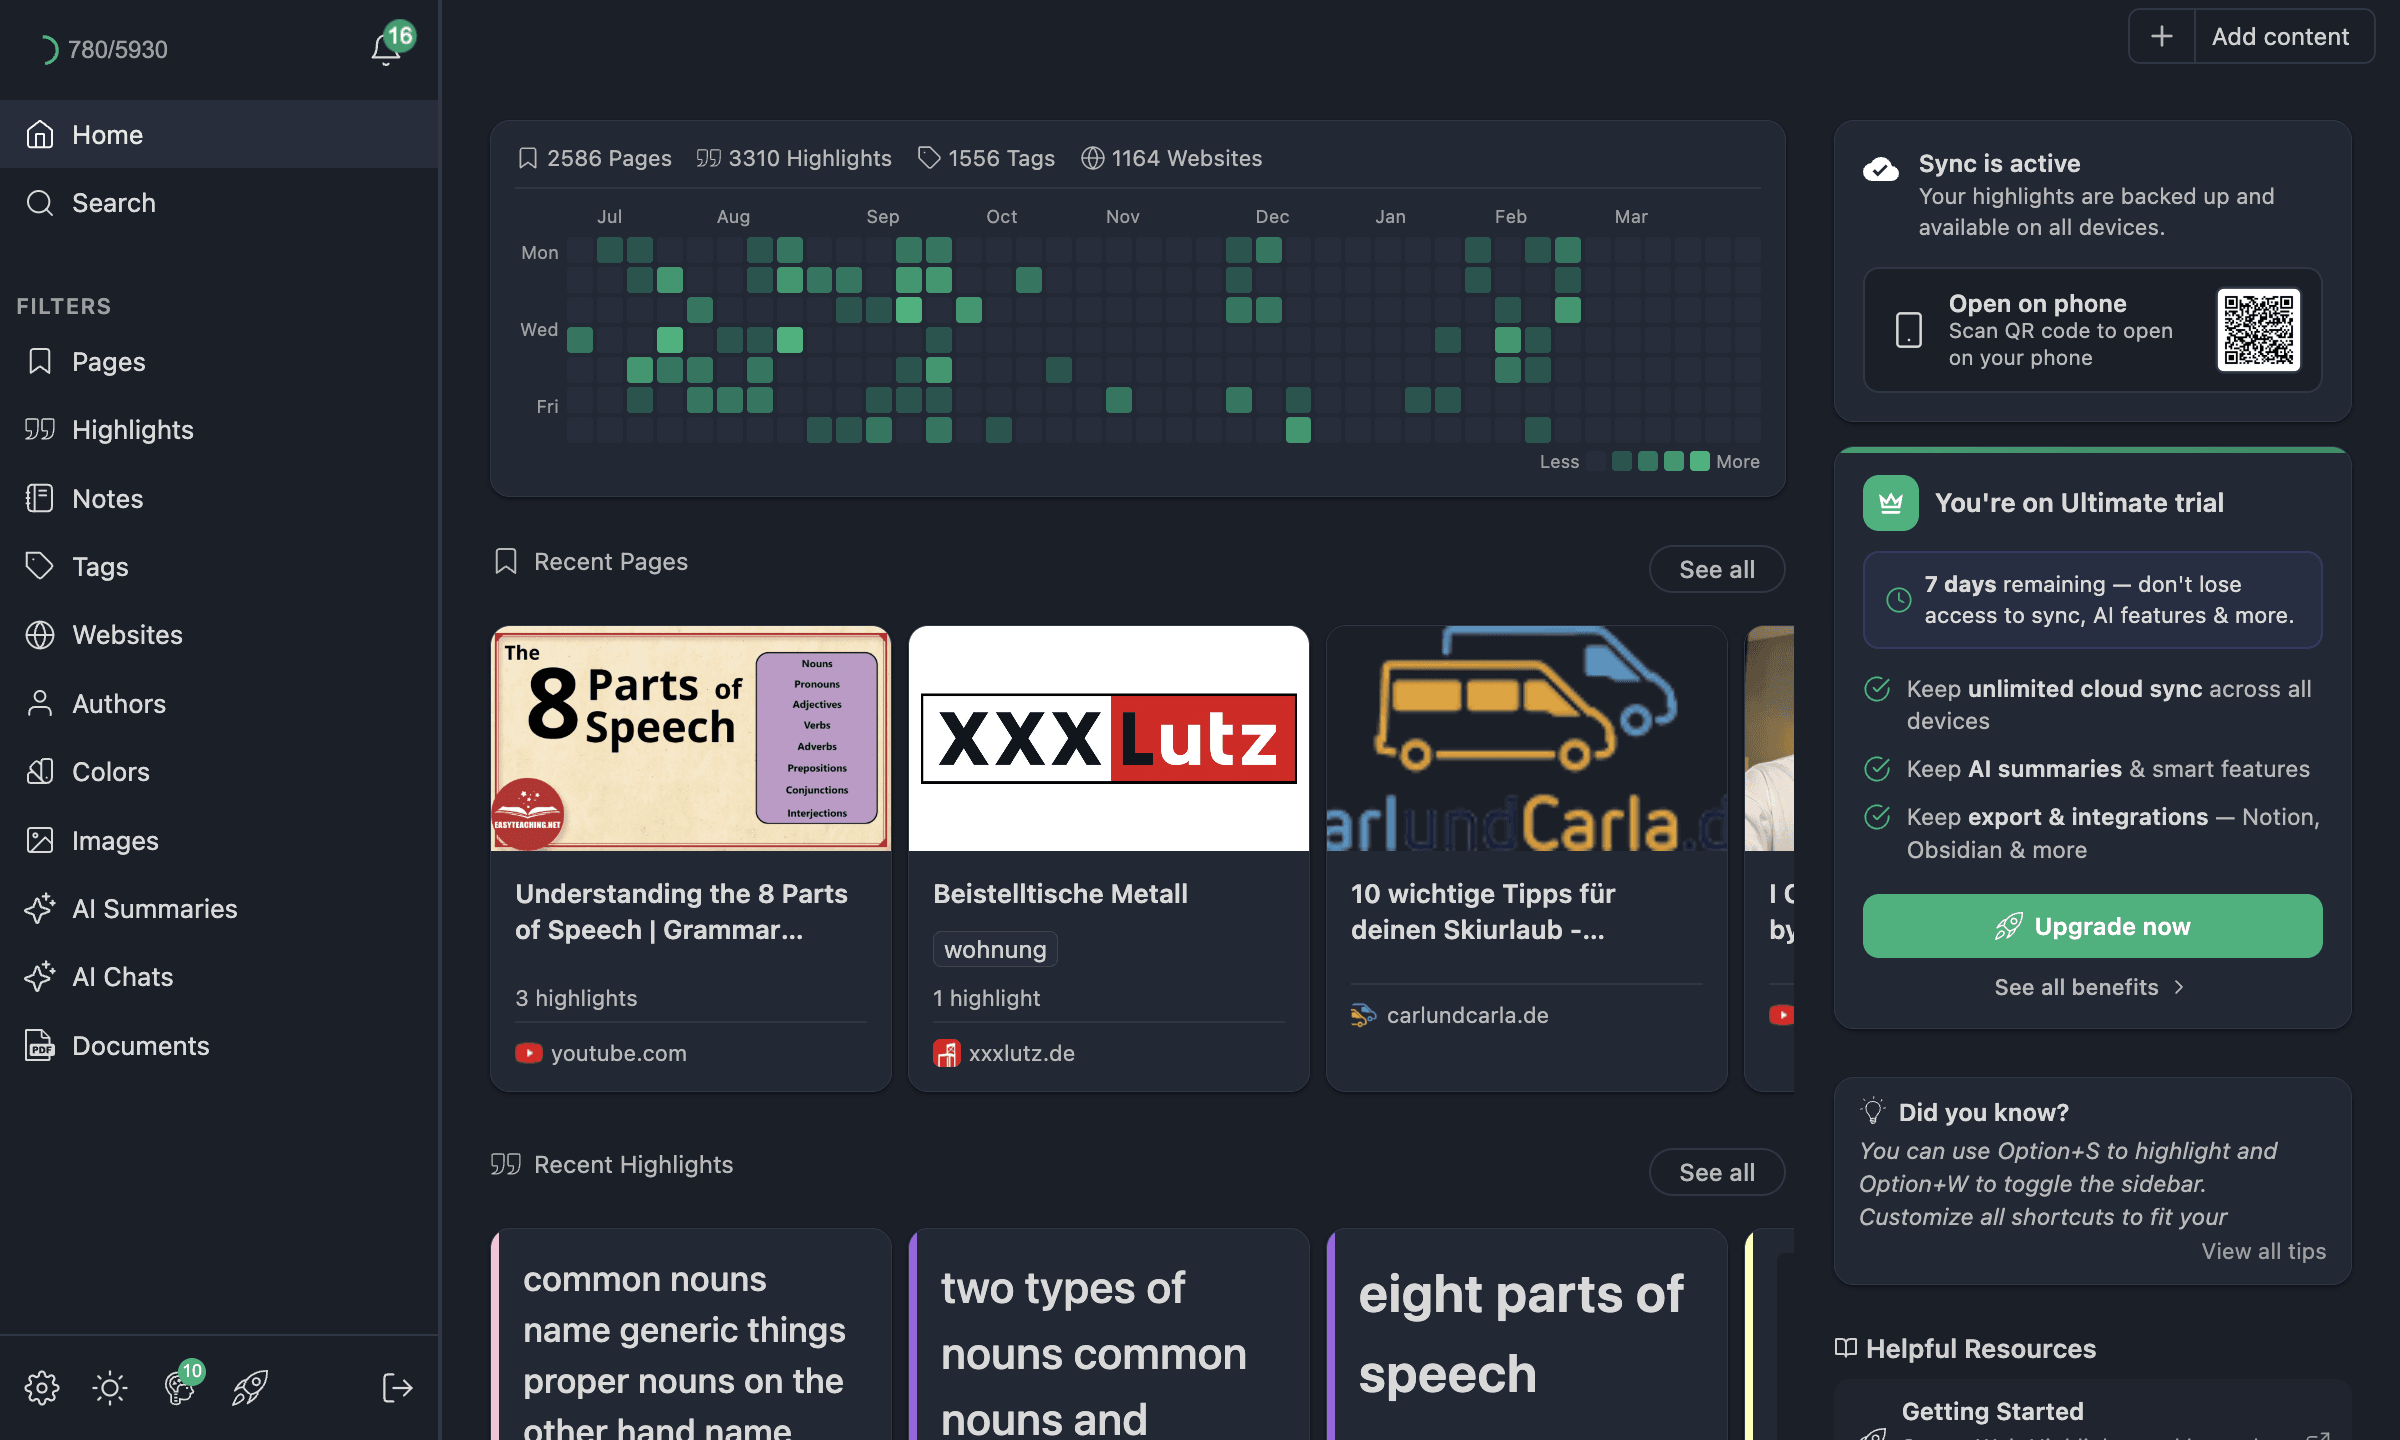
Stats Bar
At the top, you'll see your numbers at a glance:
- Pages — how many web pages you've saved
- Highlights — total highlights across all pages
- Tags — how many tags you've created
- Websites — how many unique websites you've highlighted on
Each stat is clickable. Clicking one takes you directly to a filtered grid view of that entity type — for example, clicking "Pages" opens all your saved pages.
Contribution Graph
Below the stats, there's a contribution graph — similar to what you might know from GitHub. It shows your highlighting activity over time. Each day with activity is shaded, so you can see at a glance how consistent your research routine has been.
Clicking on a specific day opens a filtered view showing only the pages and highlights from that date.
Recent Pages
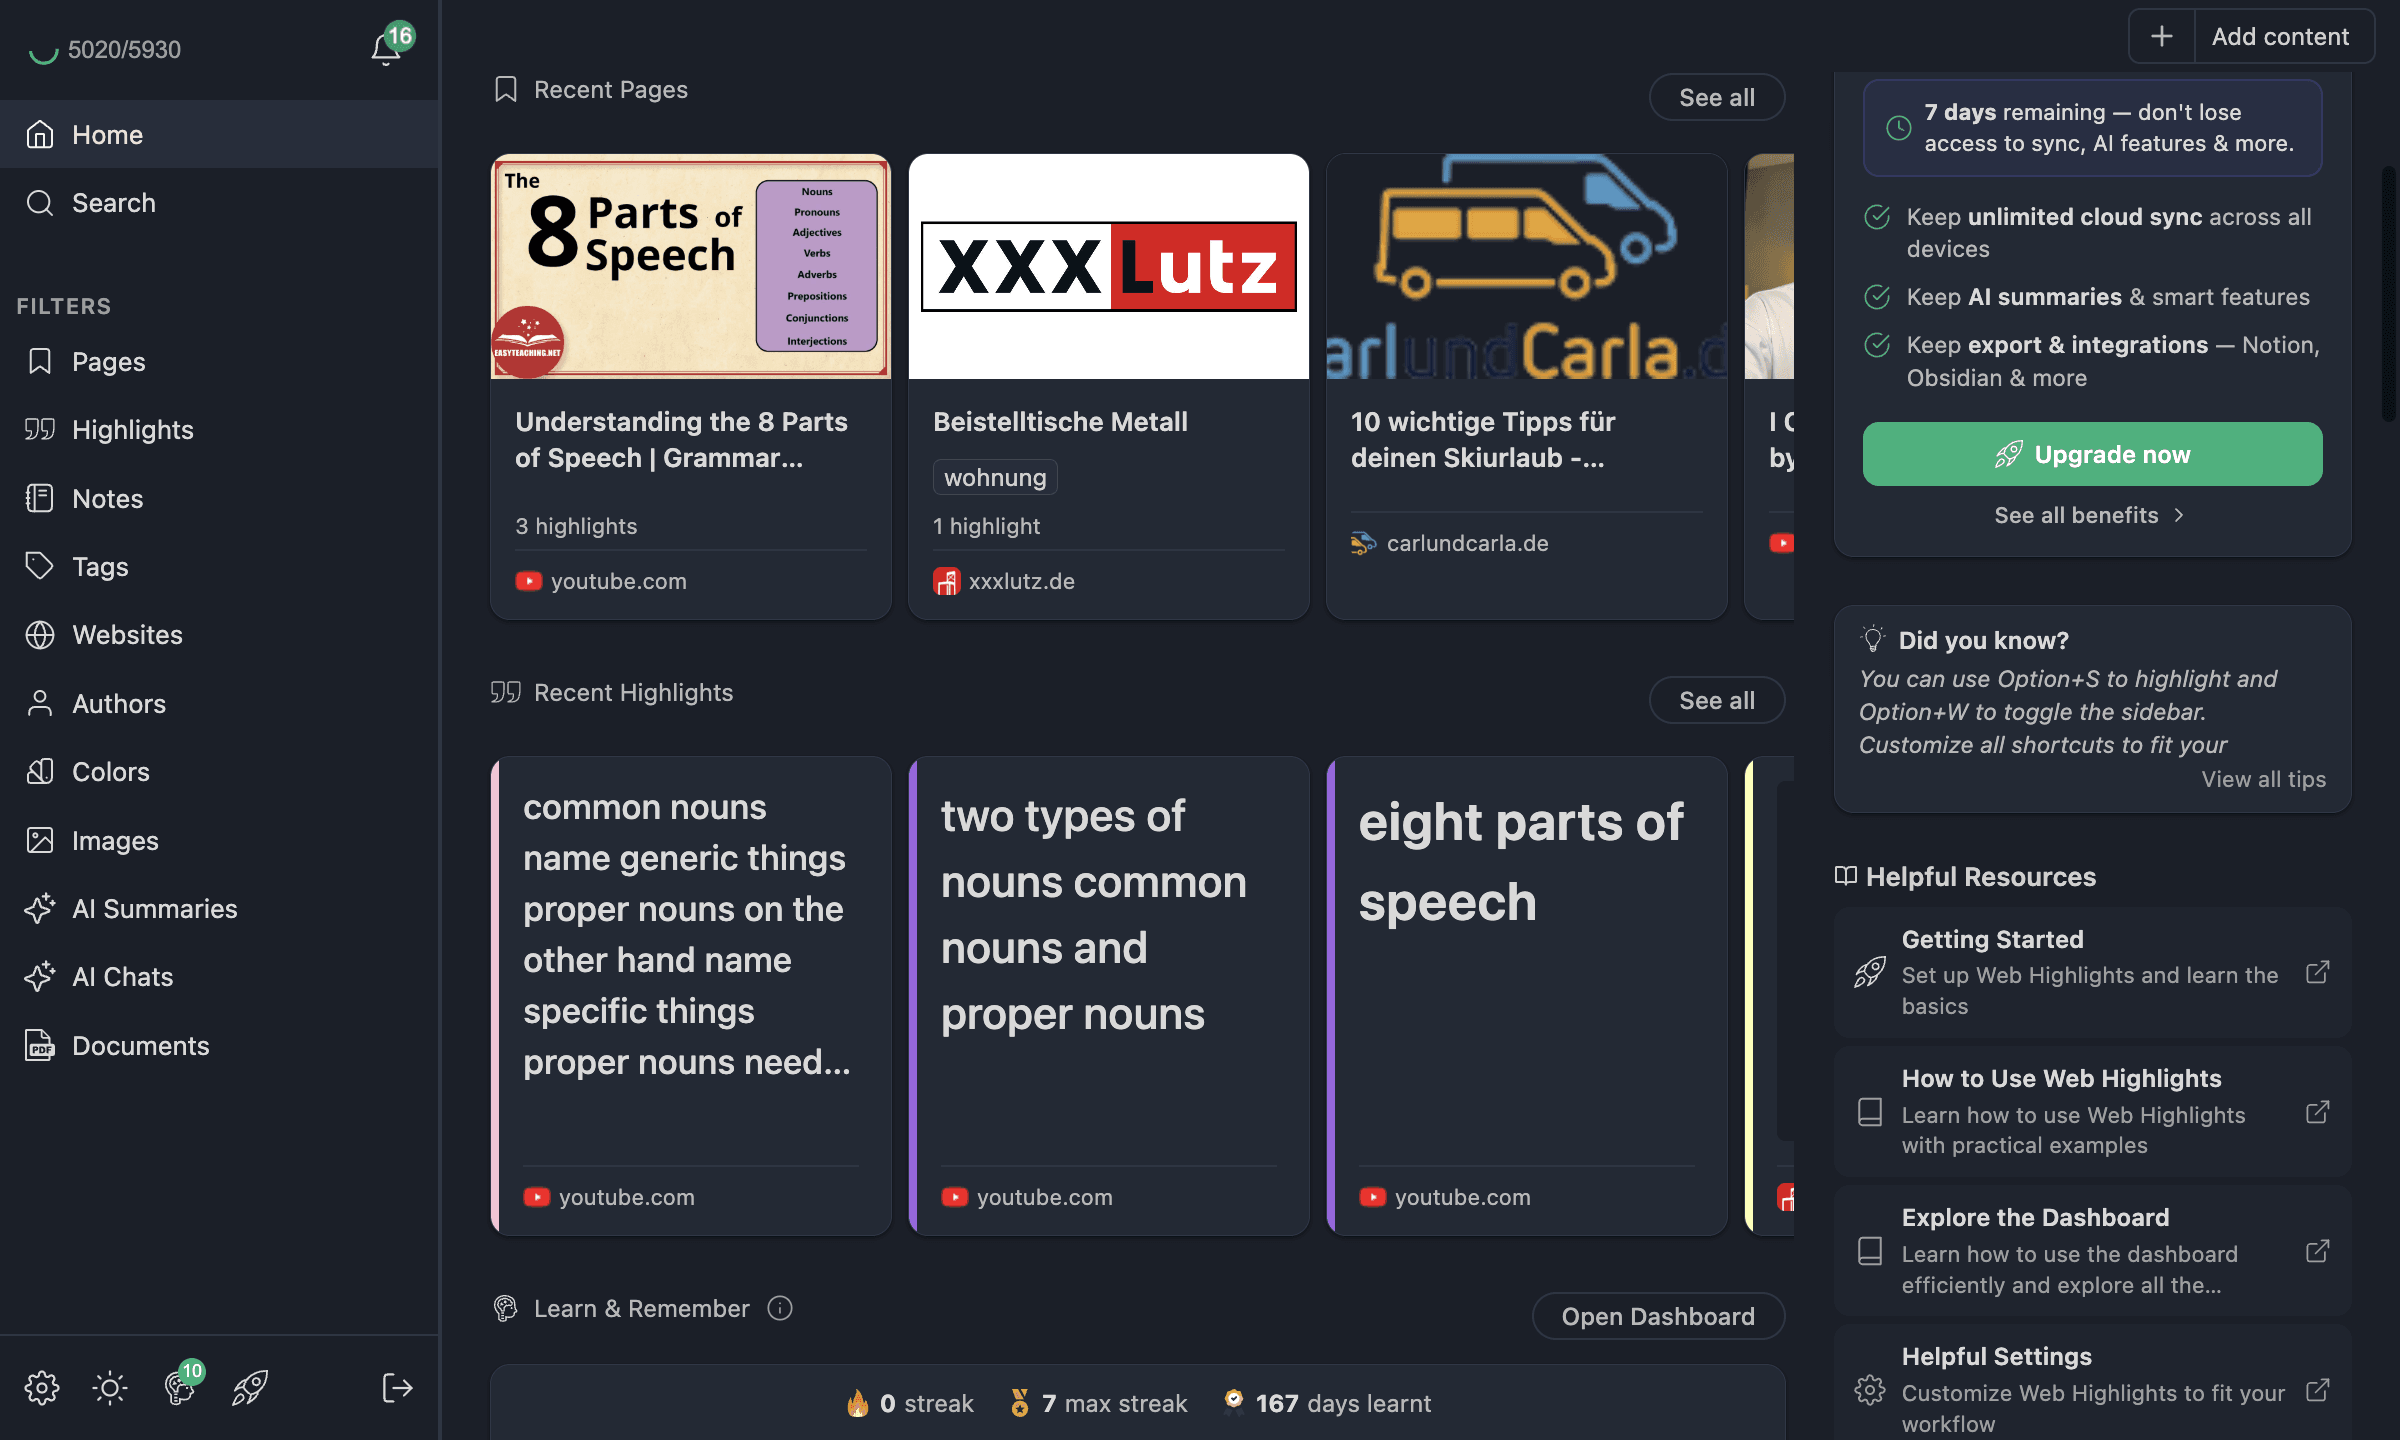
The Recent Pages section shows your latest saved pages as cards in a horizontal scroll. You can scroll through them or click See all to jump to the full Pages grid view.
Recent Highlights
Right below, the Recent Highlights section works the same way. It shows your latest highlights as cards. This is a great way to quickly revisit something you just read.
Browsing with the Sidebar Navigation
On the left side of the app view, you'll find the sidebar navigation. This is how you move between different sections of your library. The available sections are:
| Section | What it shows |
|---|---|
| Home | The dashboard (where we are now) |
| Pages | All saved web pages |
| Highlights | All your text highlights |
| Notes | All notes you've written |
| Tags | All your tags |
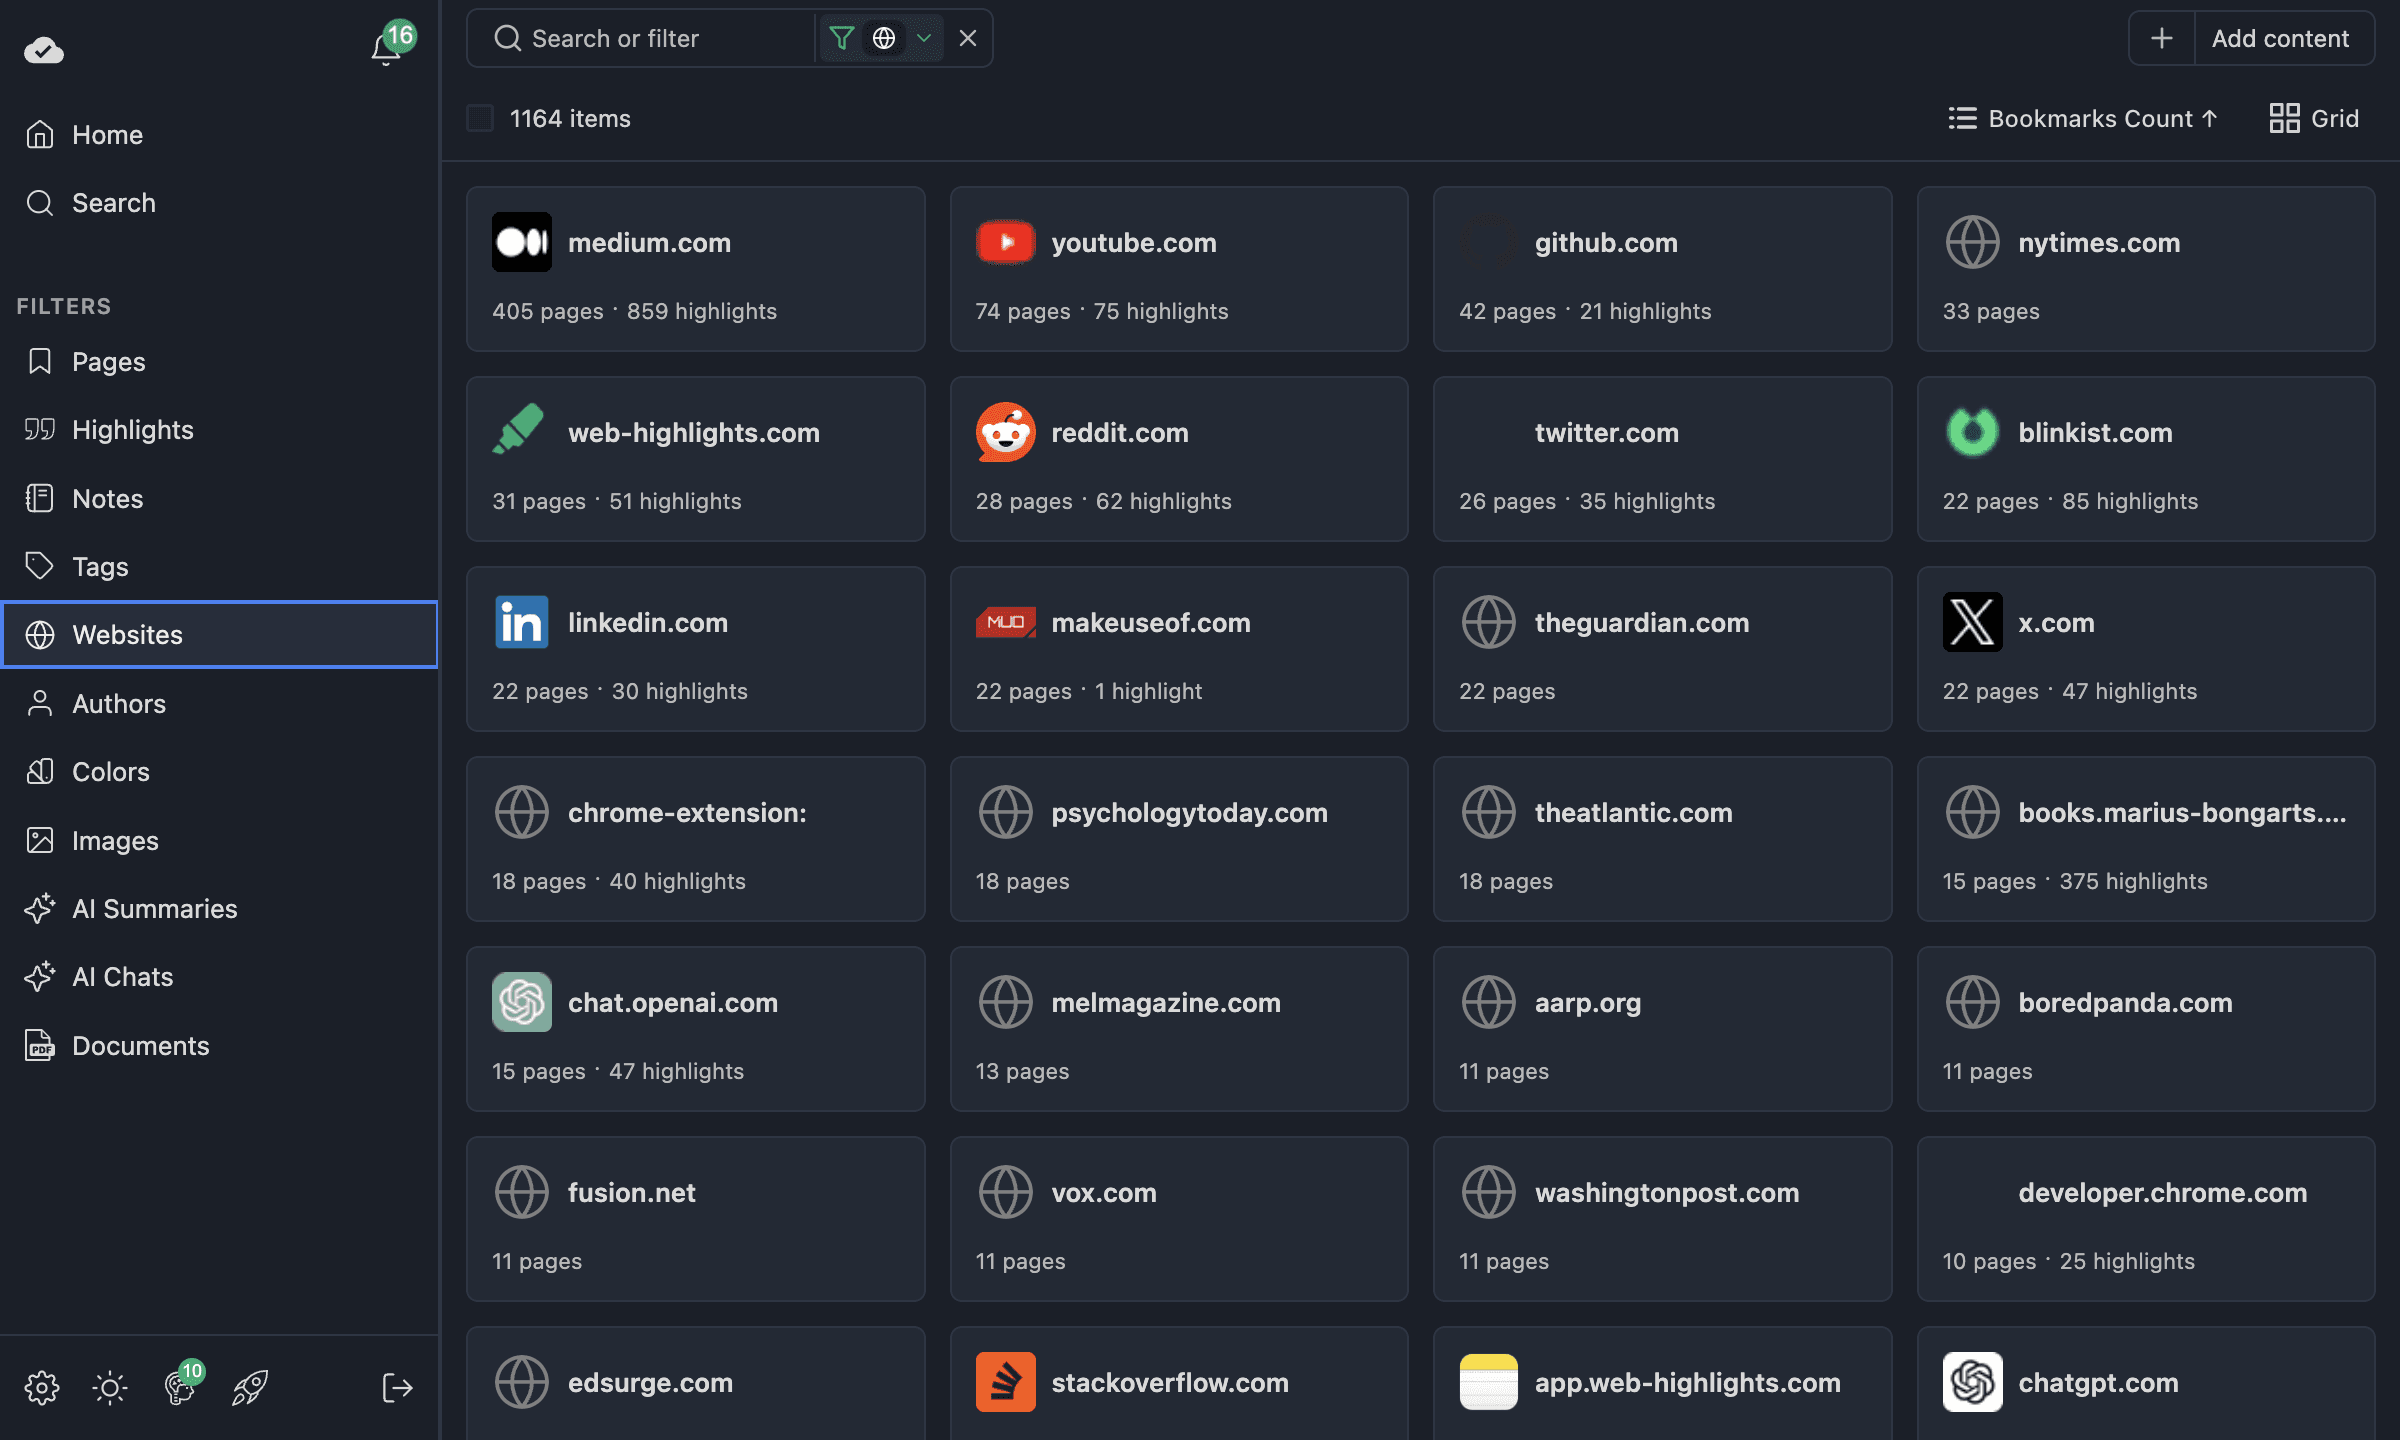
| Websites | Grouped by website domain |
| Authors | Grouped by article author |
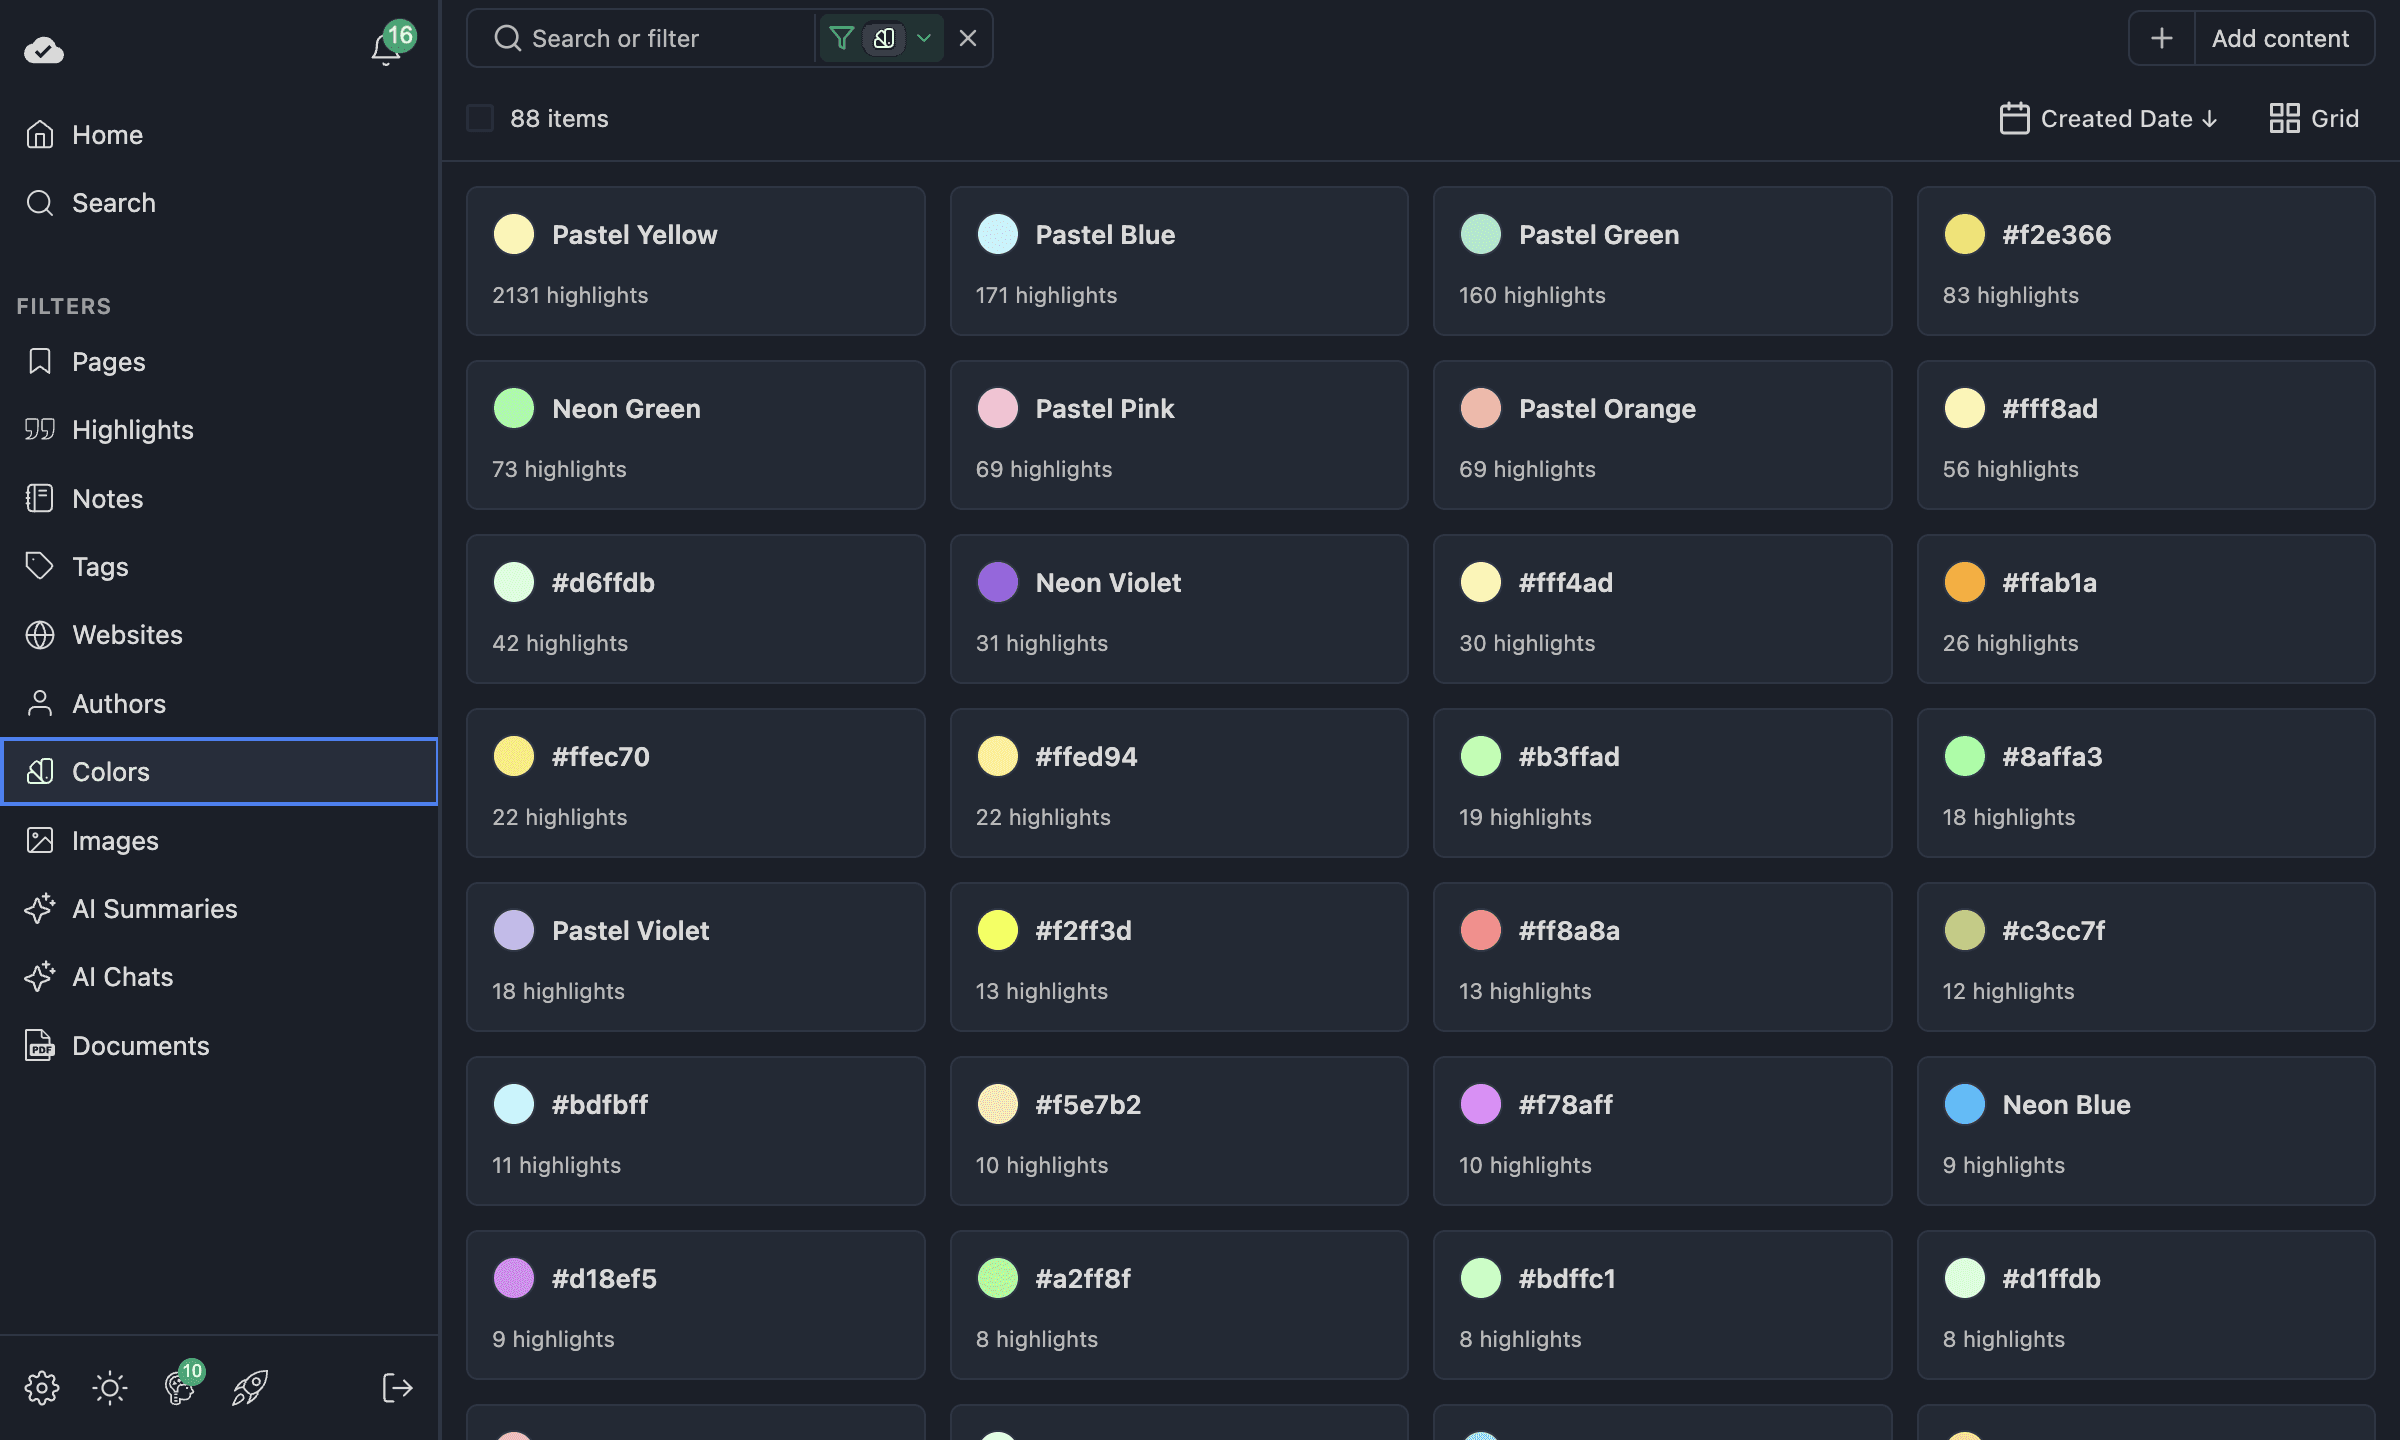
| Colors | Grouped by highlight color |
| AI Summaries | Your AI-generated summaries |
| AI Chats | Your AI chat conversations |
| Documents | Saved documents |
| Images | Your highlighted images |
| Search | Full-text search across everything |
Clicking any of these replaces the main content area with a grid view of that entity type. Let's explore that next.
Grid Views — Pages, Highlights, and More
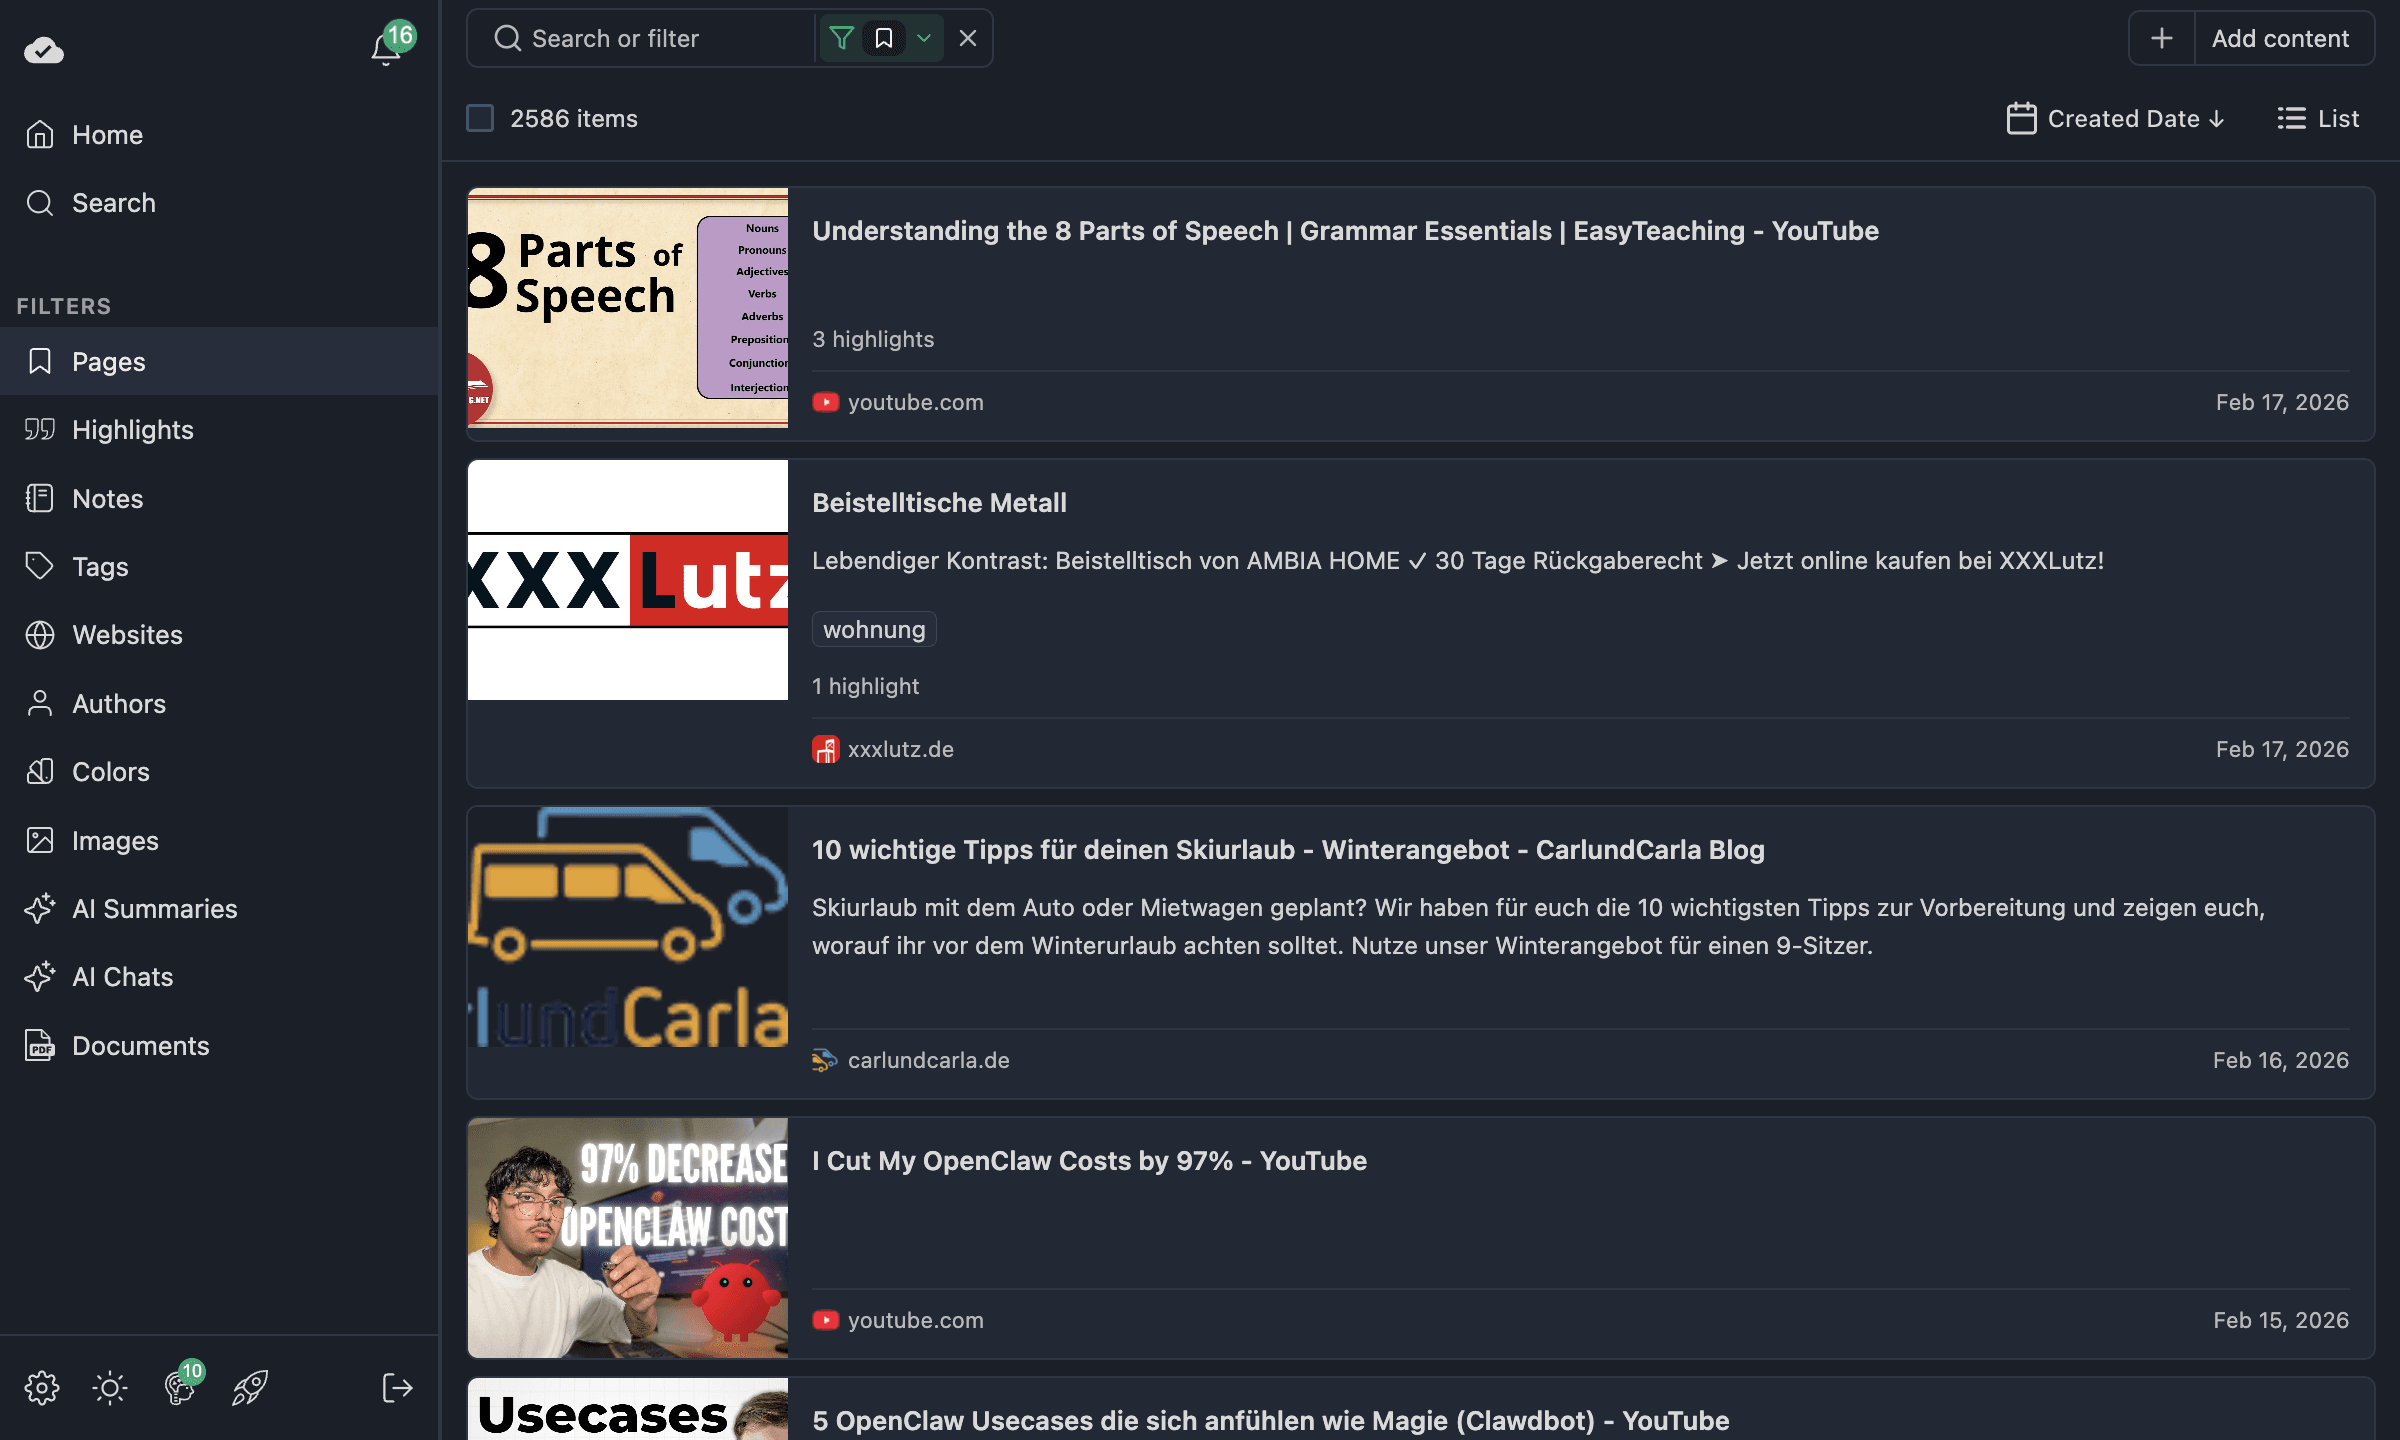
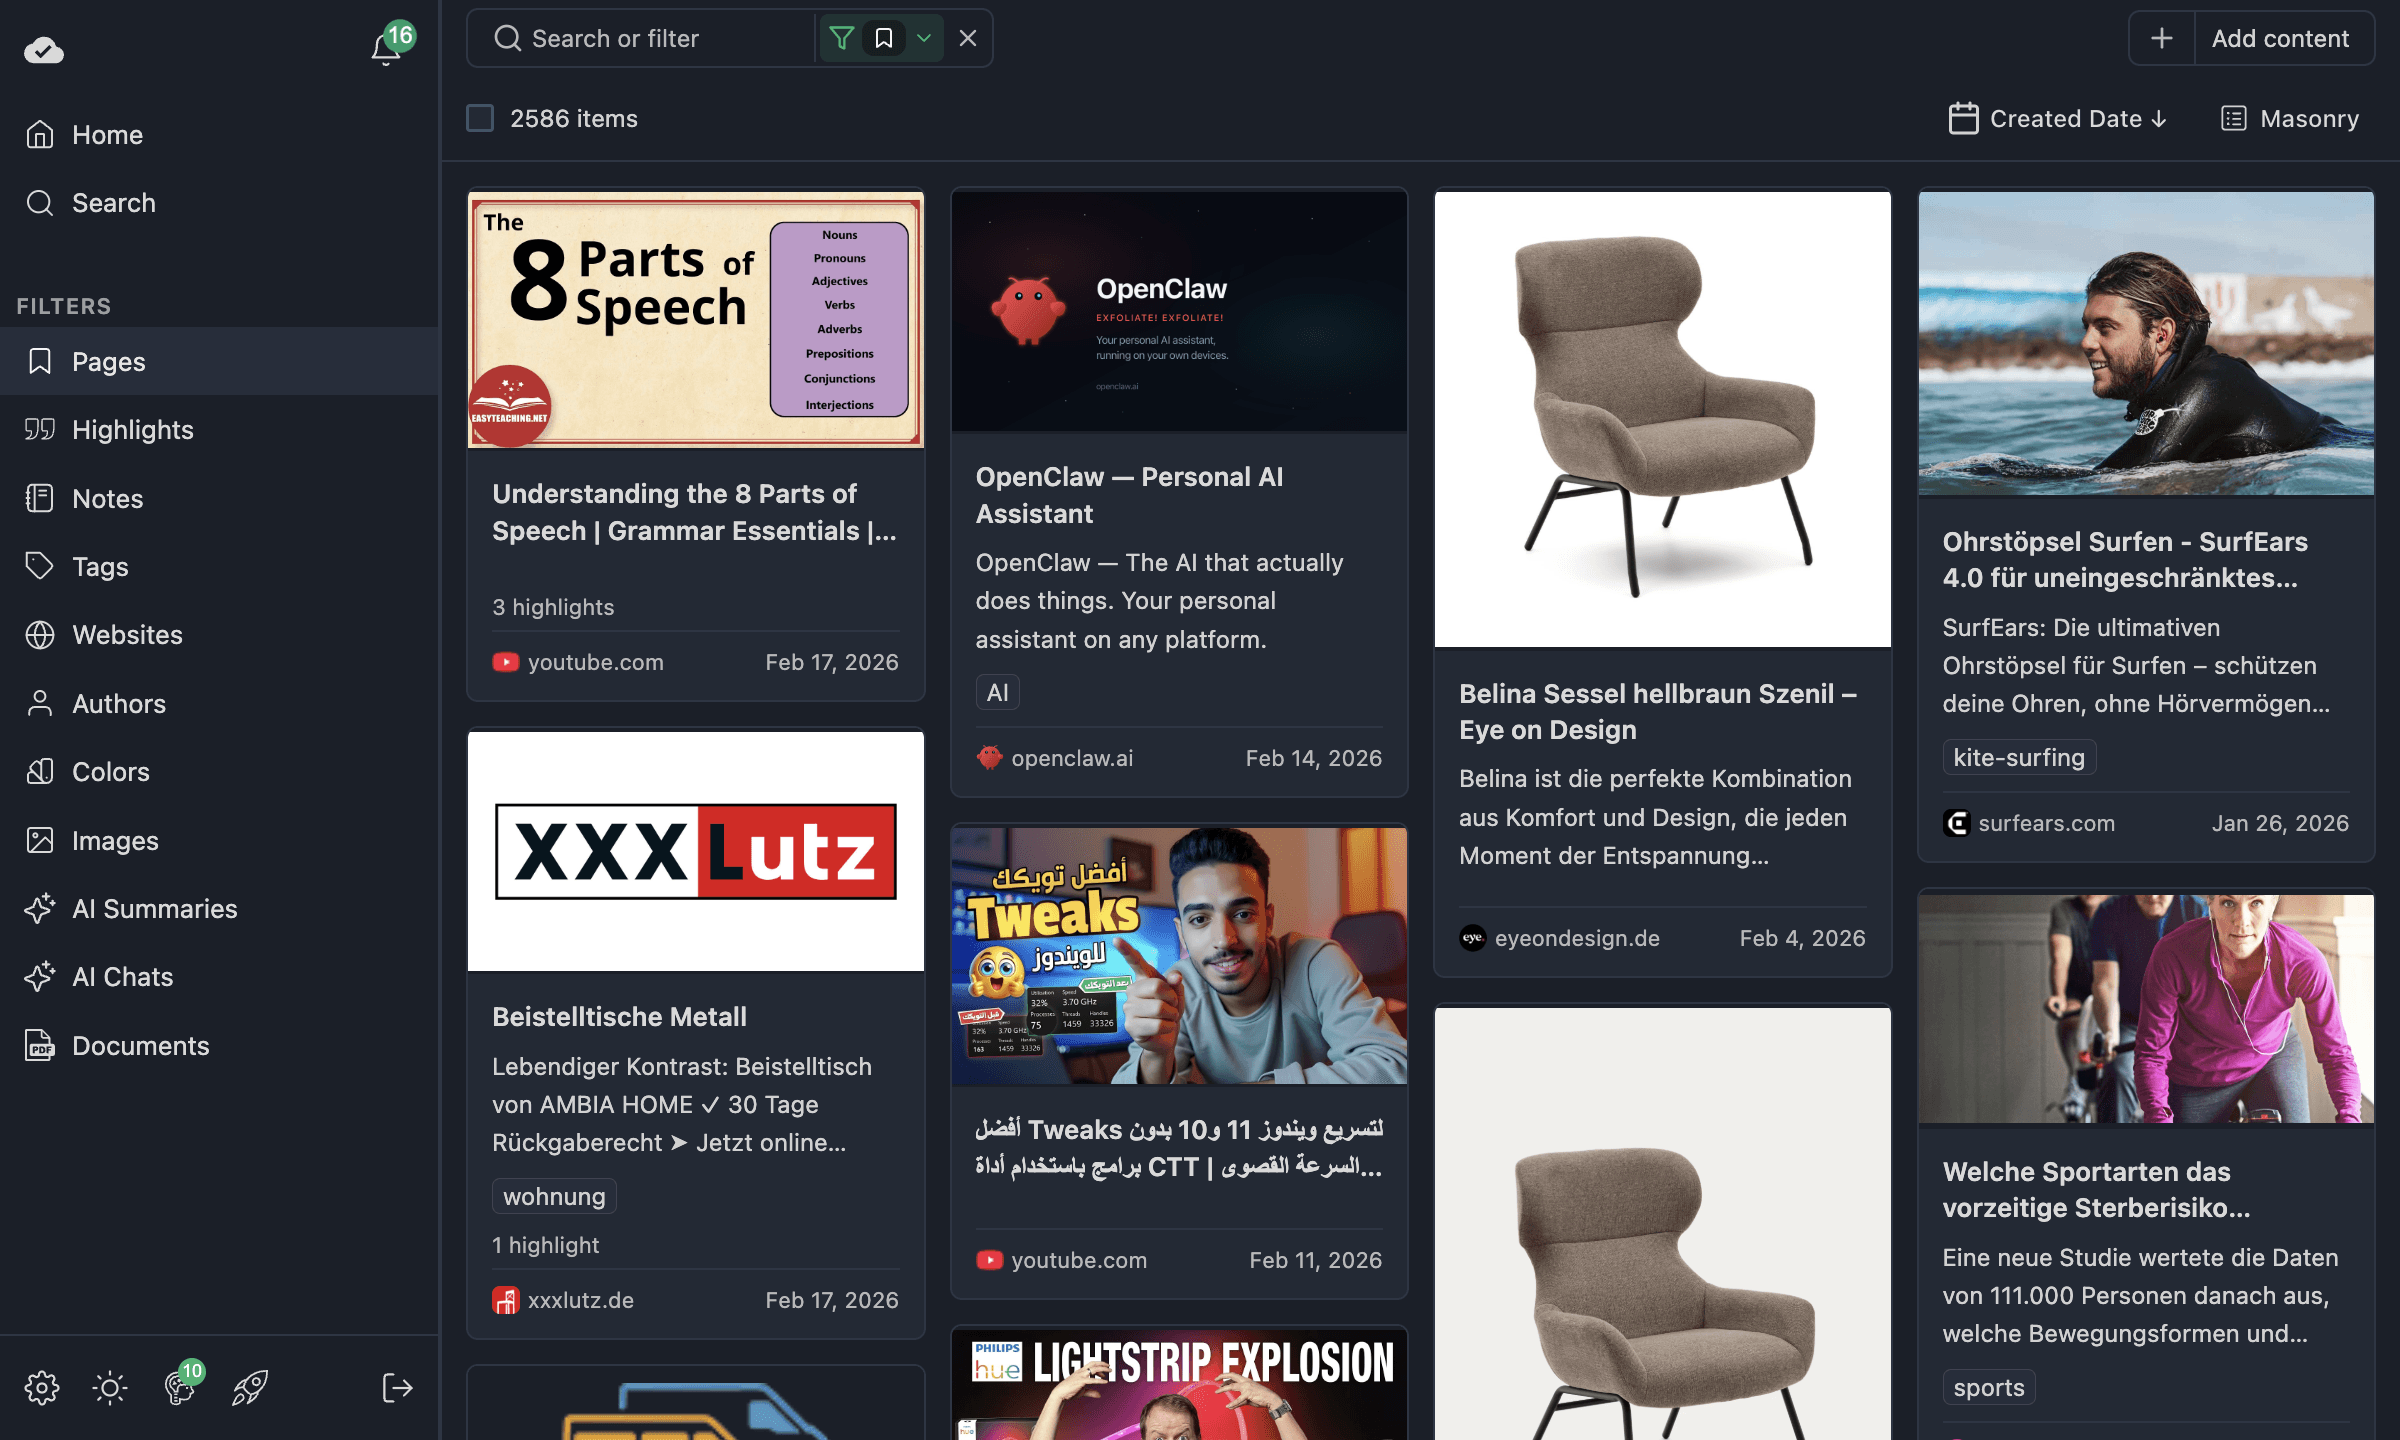
When you navigate to a section like Pages, you'll see all your saved pages in a grid layout. This is where you browse, sort, and filter your content.
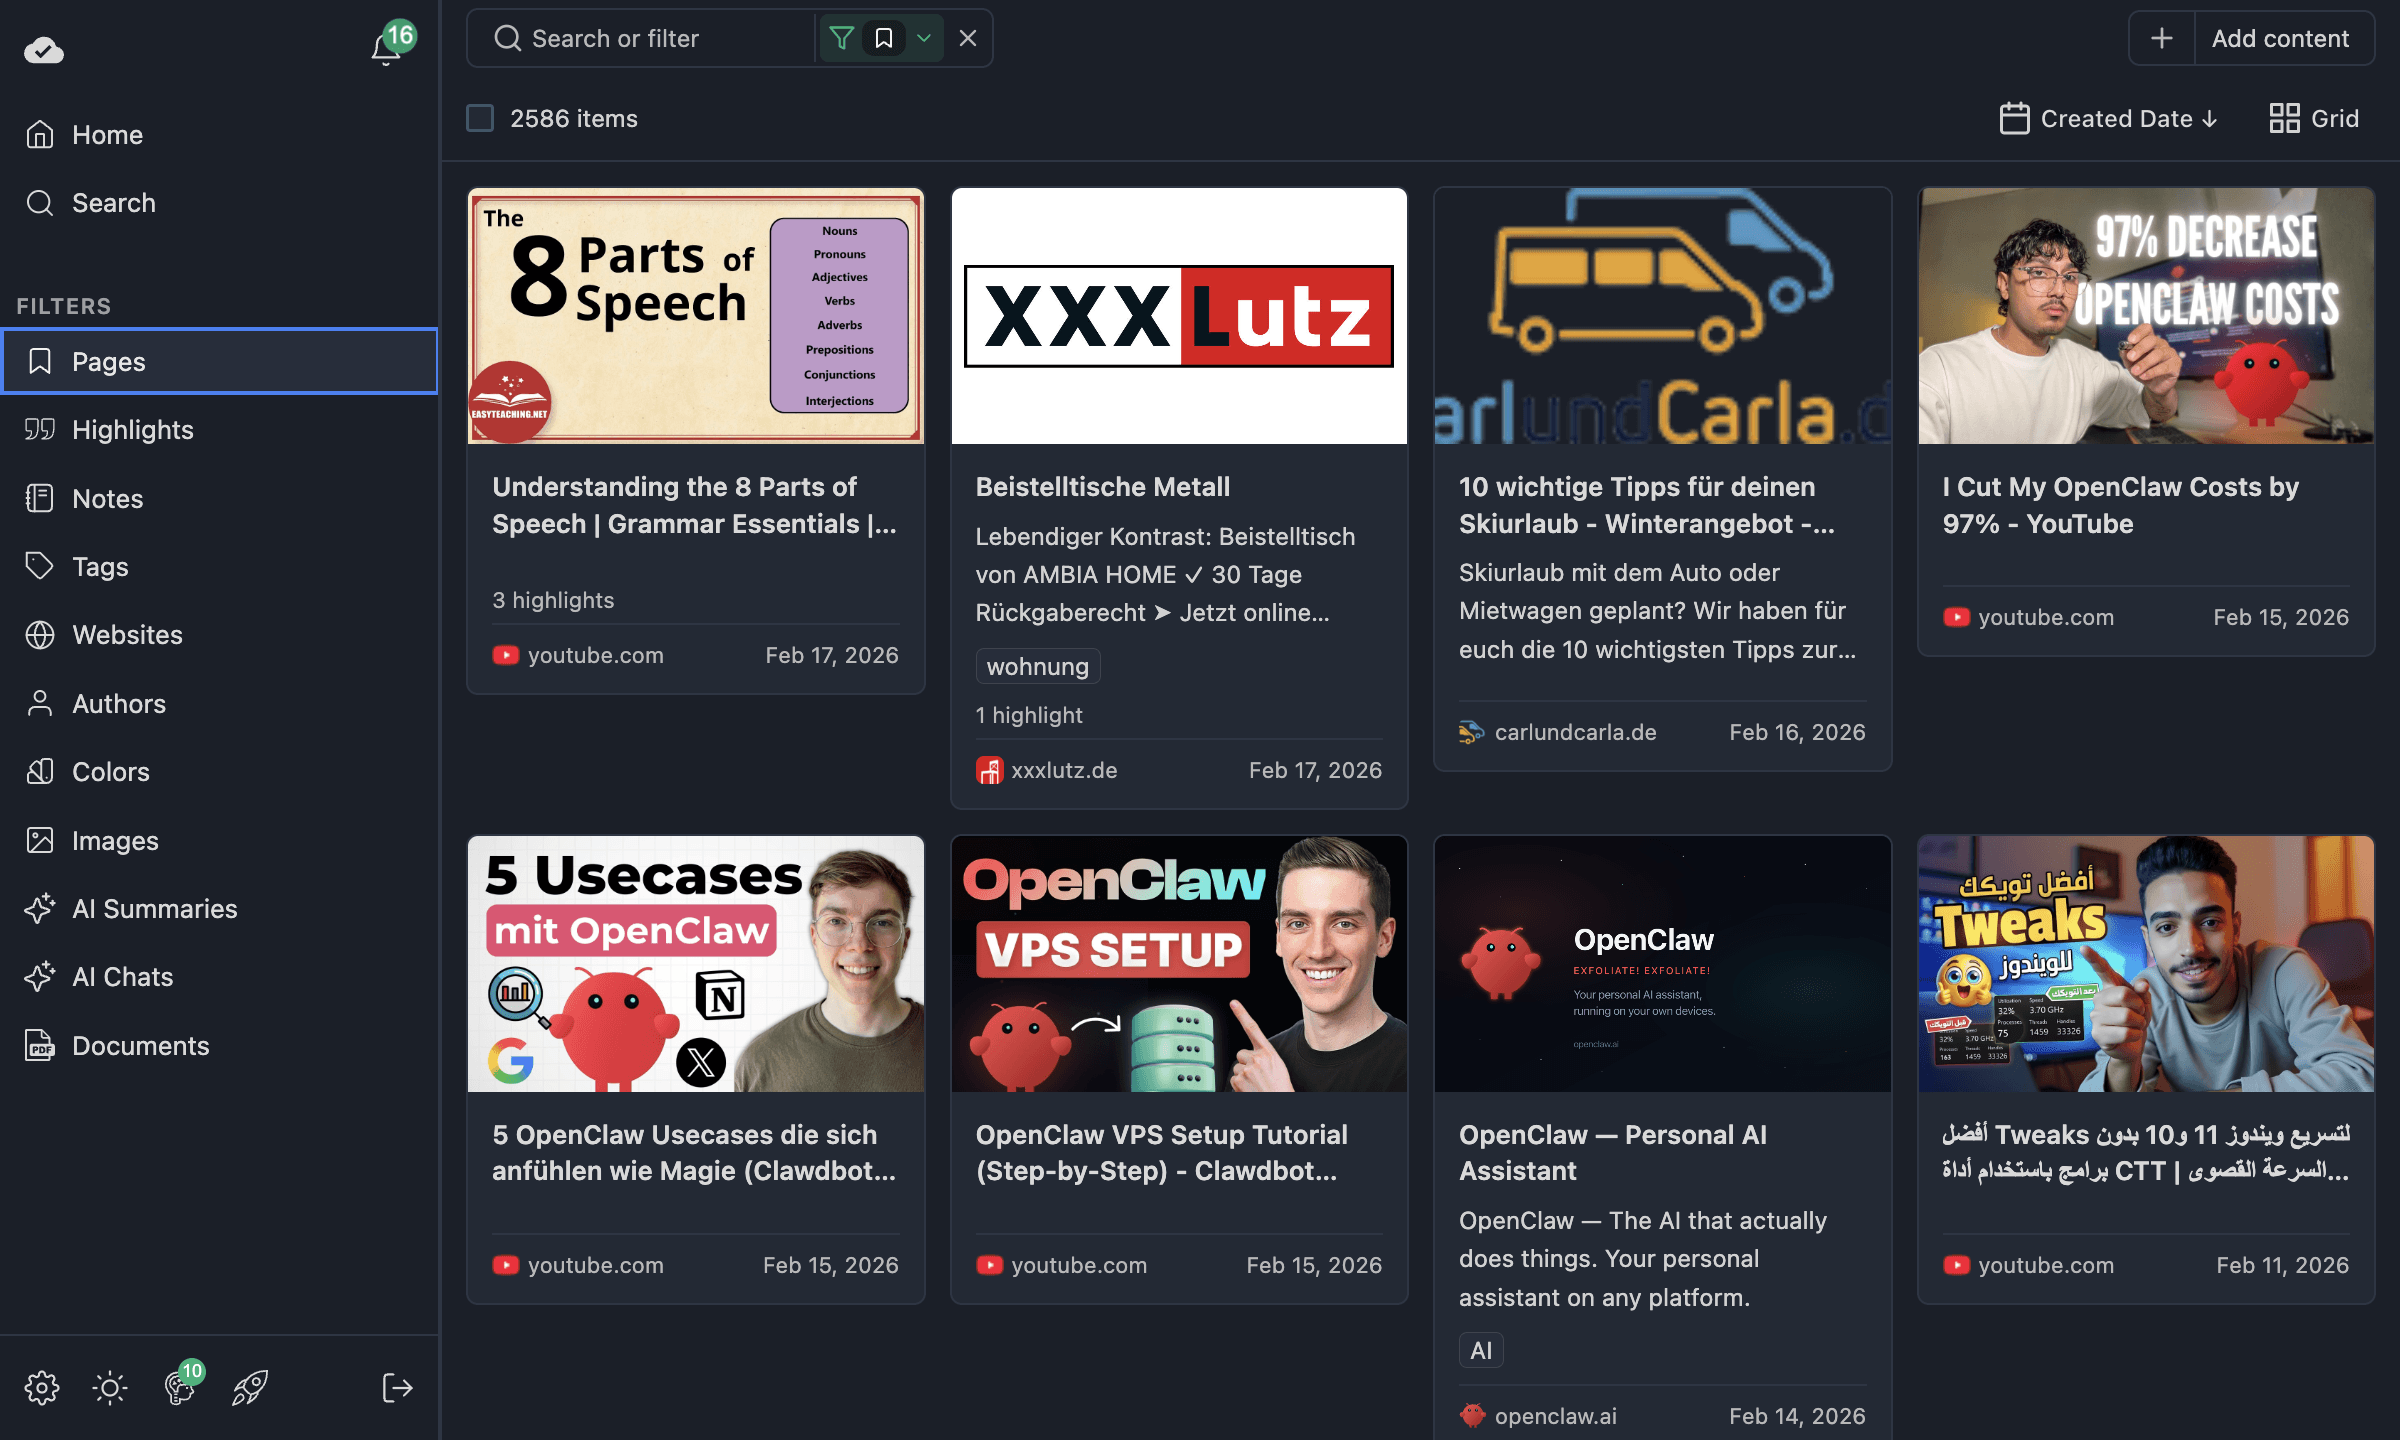
Each card shows useful info at a glance: the page title, description, website favicon, date, highlight count, notes count, and tags.
Switching View Modes
You're not stuck with one layout. Every section supports three view modes:
- Grid — card-based layout, great for visual scanning
- List — compact vertical list, great for skimming titles
- Masonry — Pinterest-style staggered layout, great for highlights of varying lengths
Switch between them using the view mode selector in the toolbar. Your choice is remembered per section — so you can use Grid for Pages and Masonry for Highlights without reconfiguring every time.
TIP
For highlights and notes, Masonry is often the best choice since text snippets vary in length. For pages, Grid gives you a clean card overview.
Sorting Your Content
Use the sort menu in the toolbar to change how items are ordered. Available sort options depend on the section:
| Section | Sort options |
|---|---|
| Pages | Created Date, Title, Highlights Count, Notes Count |
| Highlights | Created Date, Text |
| Tags | Name, Highlights Count, Bookmarks Count |
| Websites | Name, Bookmarks Count, Highlights Count |
| Authors | Name, Bookmarks Count |
Click the same sort option twice to reverse the direction (ascending ↔ descending).
Drill-Down Navigation
This is where things get powerful. Many items act as drill-down filters when you click them:
- Click a Tag → see all pages and highlights with that tag
- Click a Website → see everything from that domain
- Click a Color → see all highlights in that color
- Click the highlight count on a page card → see only that page's highlights
- Click the notes count on a page card → see only that page's notes
Each drill-down applies a filter automatically. You'll see filter badges appear in the toolbar showing what's active. To go back, just clear the filter or navigate to another section.
Highlights View
The Highlights section deserves special attention because it's where most of your research lives.
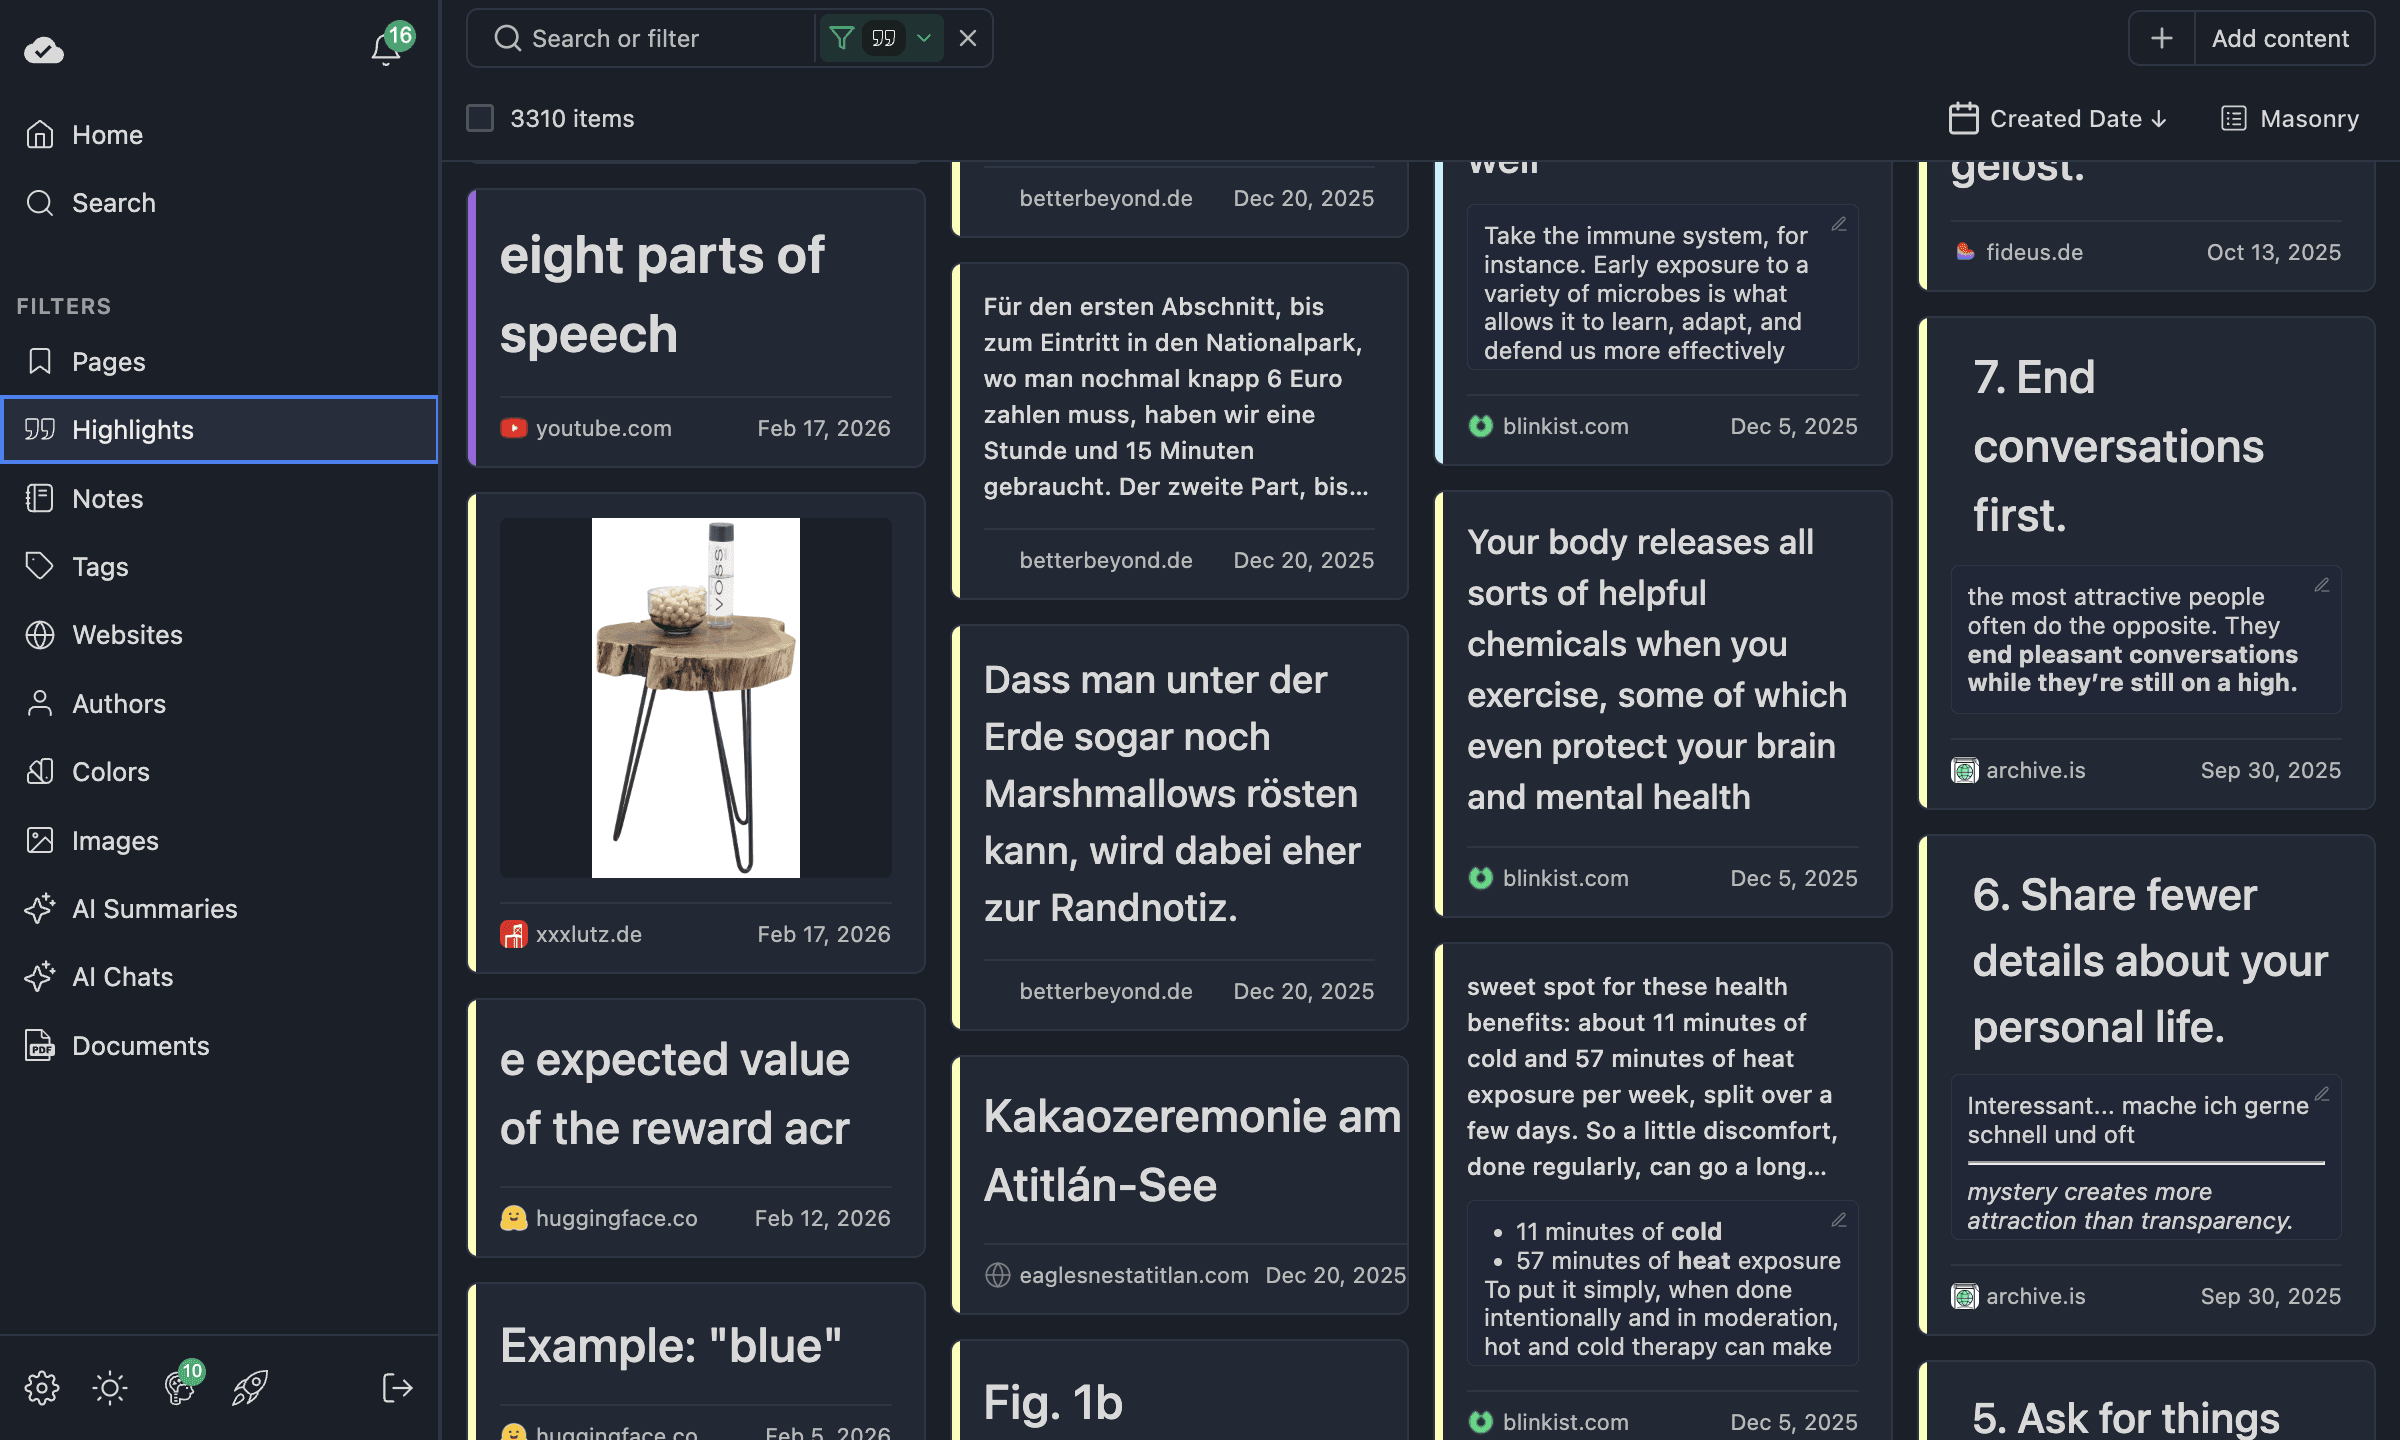
Each highlight card shows the text you highlighted, the source website, the date, and any tags or notes attached. In Masonry view, shorter highlights take up less space, giving you a dense overview of everything you've captured.
Tags, Websites, Colors, and More
Each section in the sidebar has its own grid view optimized for that entity type.
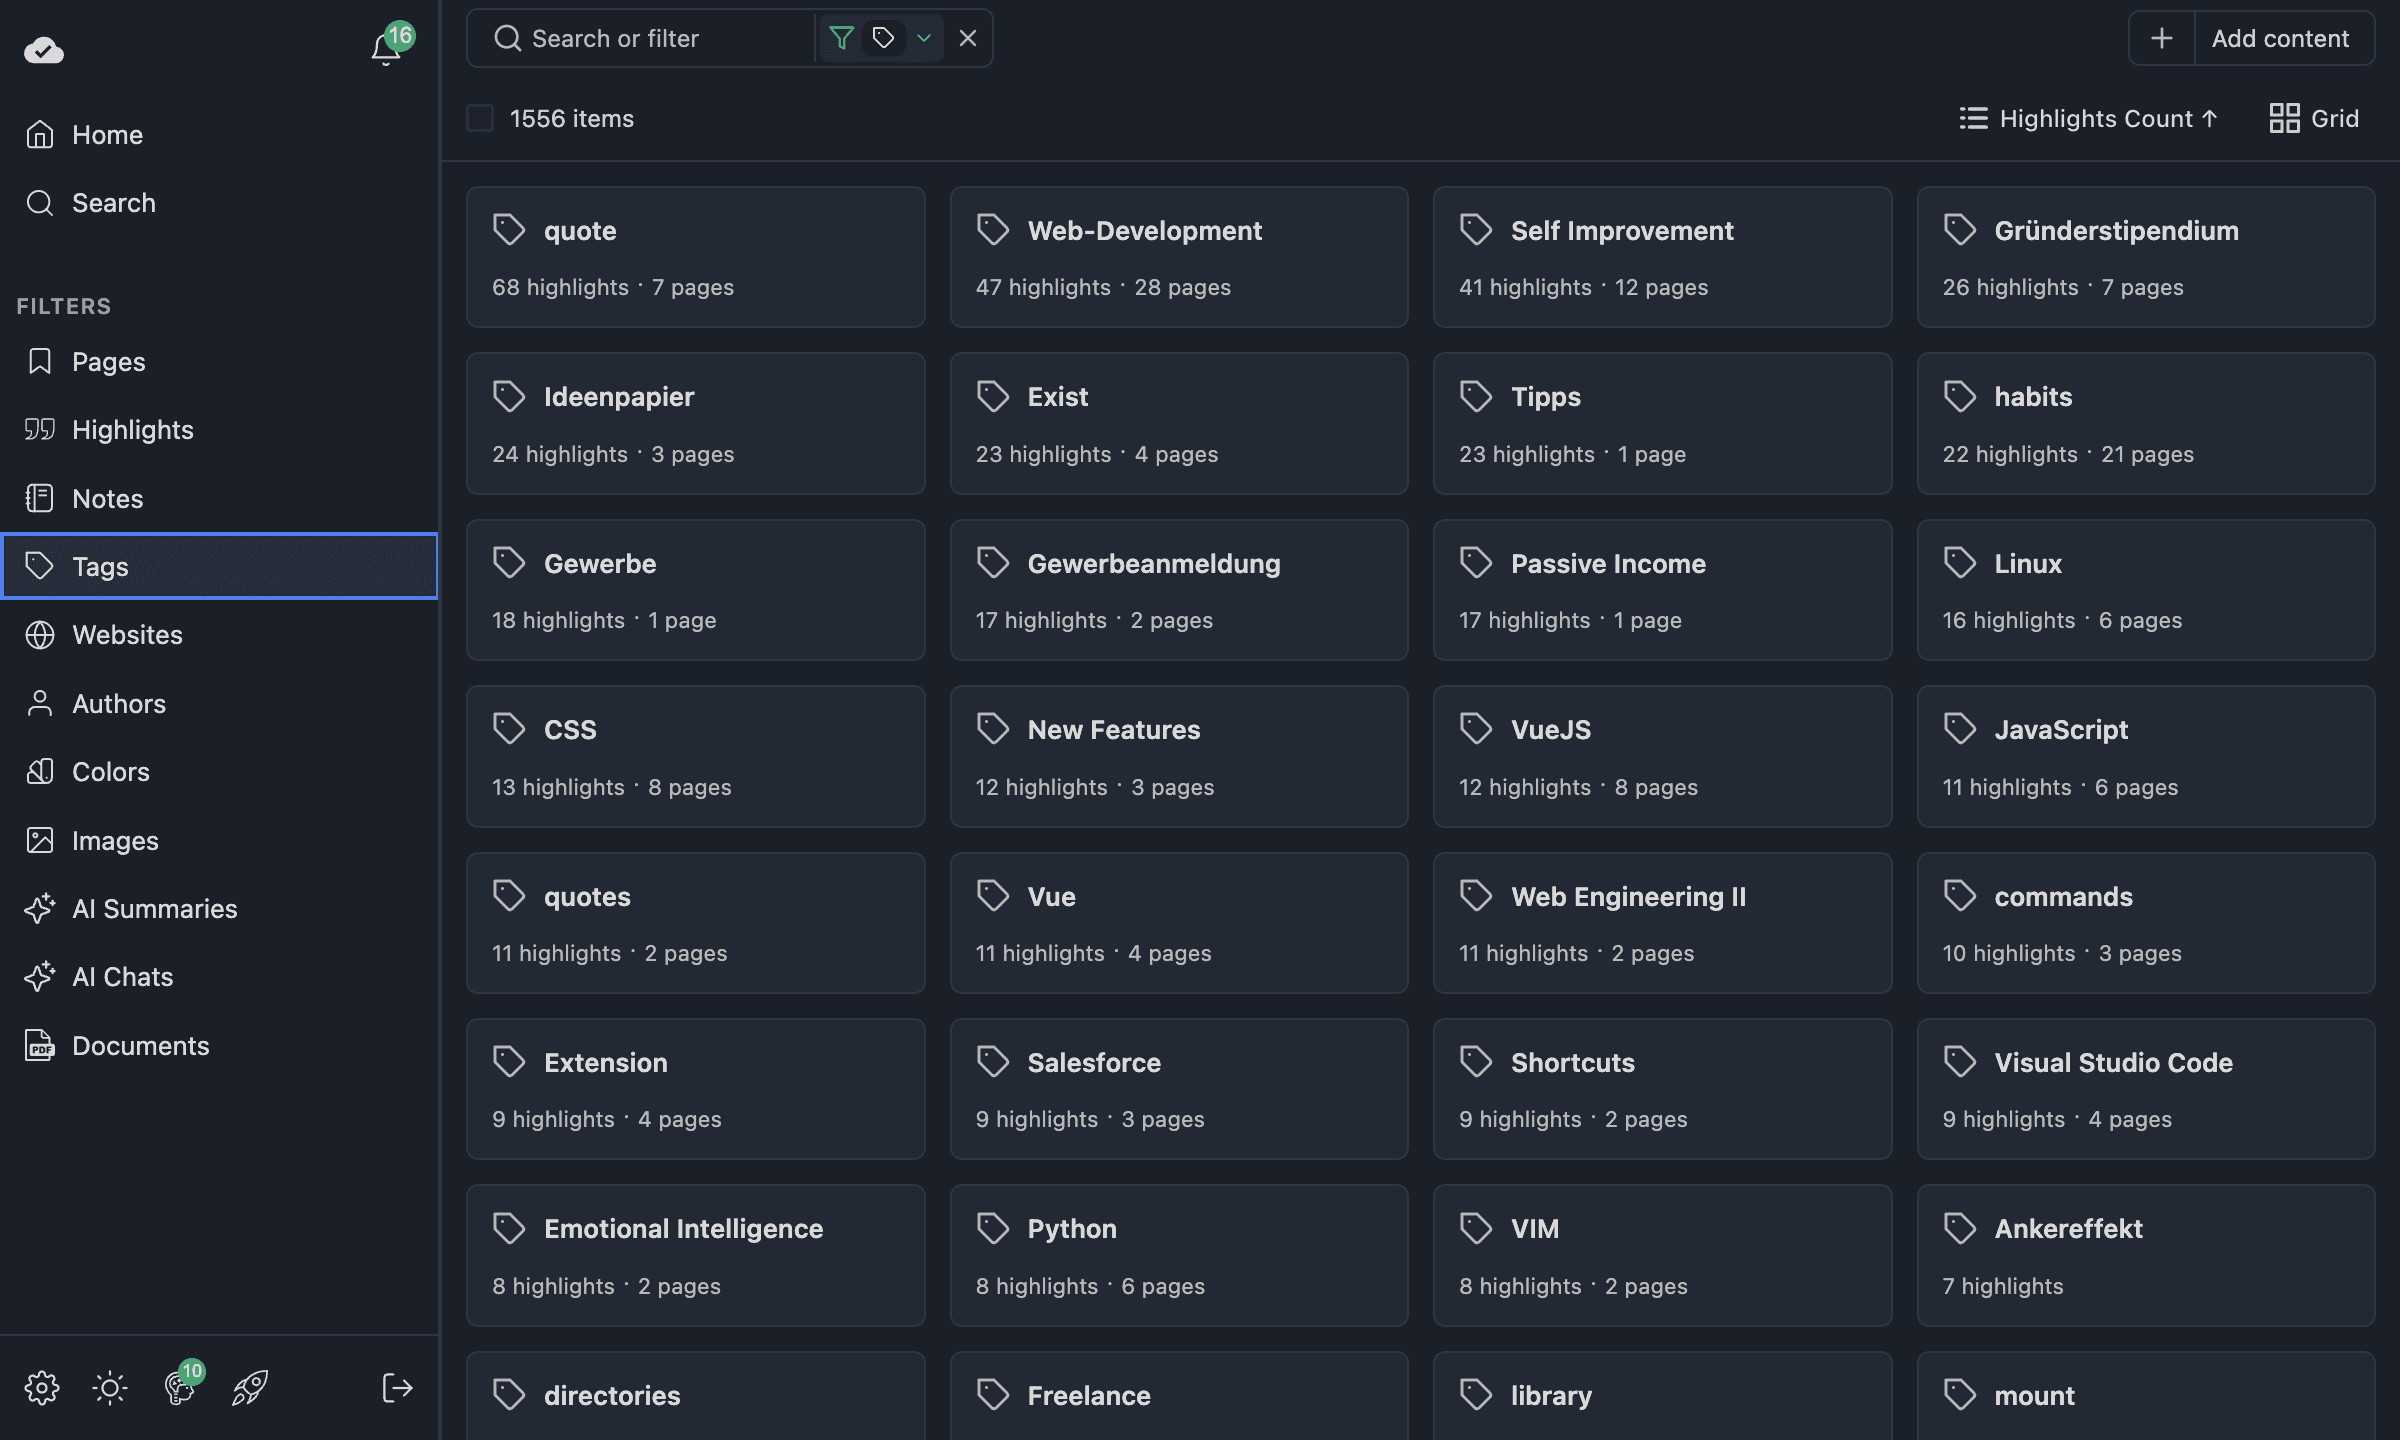
All of these views support Grid, List, and Masonry layouts, and all of them let you click an item to drill down into its related content.
Search
The Search section lets you find anything across your entire library. Type a keyword and results show up immediately — spanning pages, highlights, notes, AI summaries, and more.
Within any other section (like Pages or Highlights), the search field narrows results within that section only. This means you can search specifically within your highlights without pages mixed in.
For more details on search, see the Grid, Search & Filters reference.
Advanced Filters
This is one of the most requested features, and it's built into every grid view.
Open the filter bar (the funnel icon next to the search field) to add filters. You can filter by:
- Tag — show only items with a specific tag
- Website — show only items from a specific domain
- Author — filter by article author
- Color — filter by highlight color
- Date range — narrow to a specific time period
- Notes — show only items with (or without) notes
- Media type — filter by content type
AND / OR Logic
Here's what makes this really powerful: when you add multiple filters of the same type (e.g. two tags), you can choose between AND and OR logic.
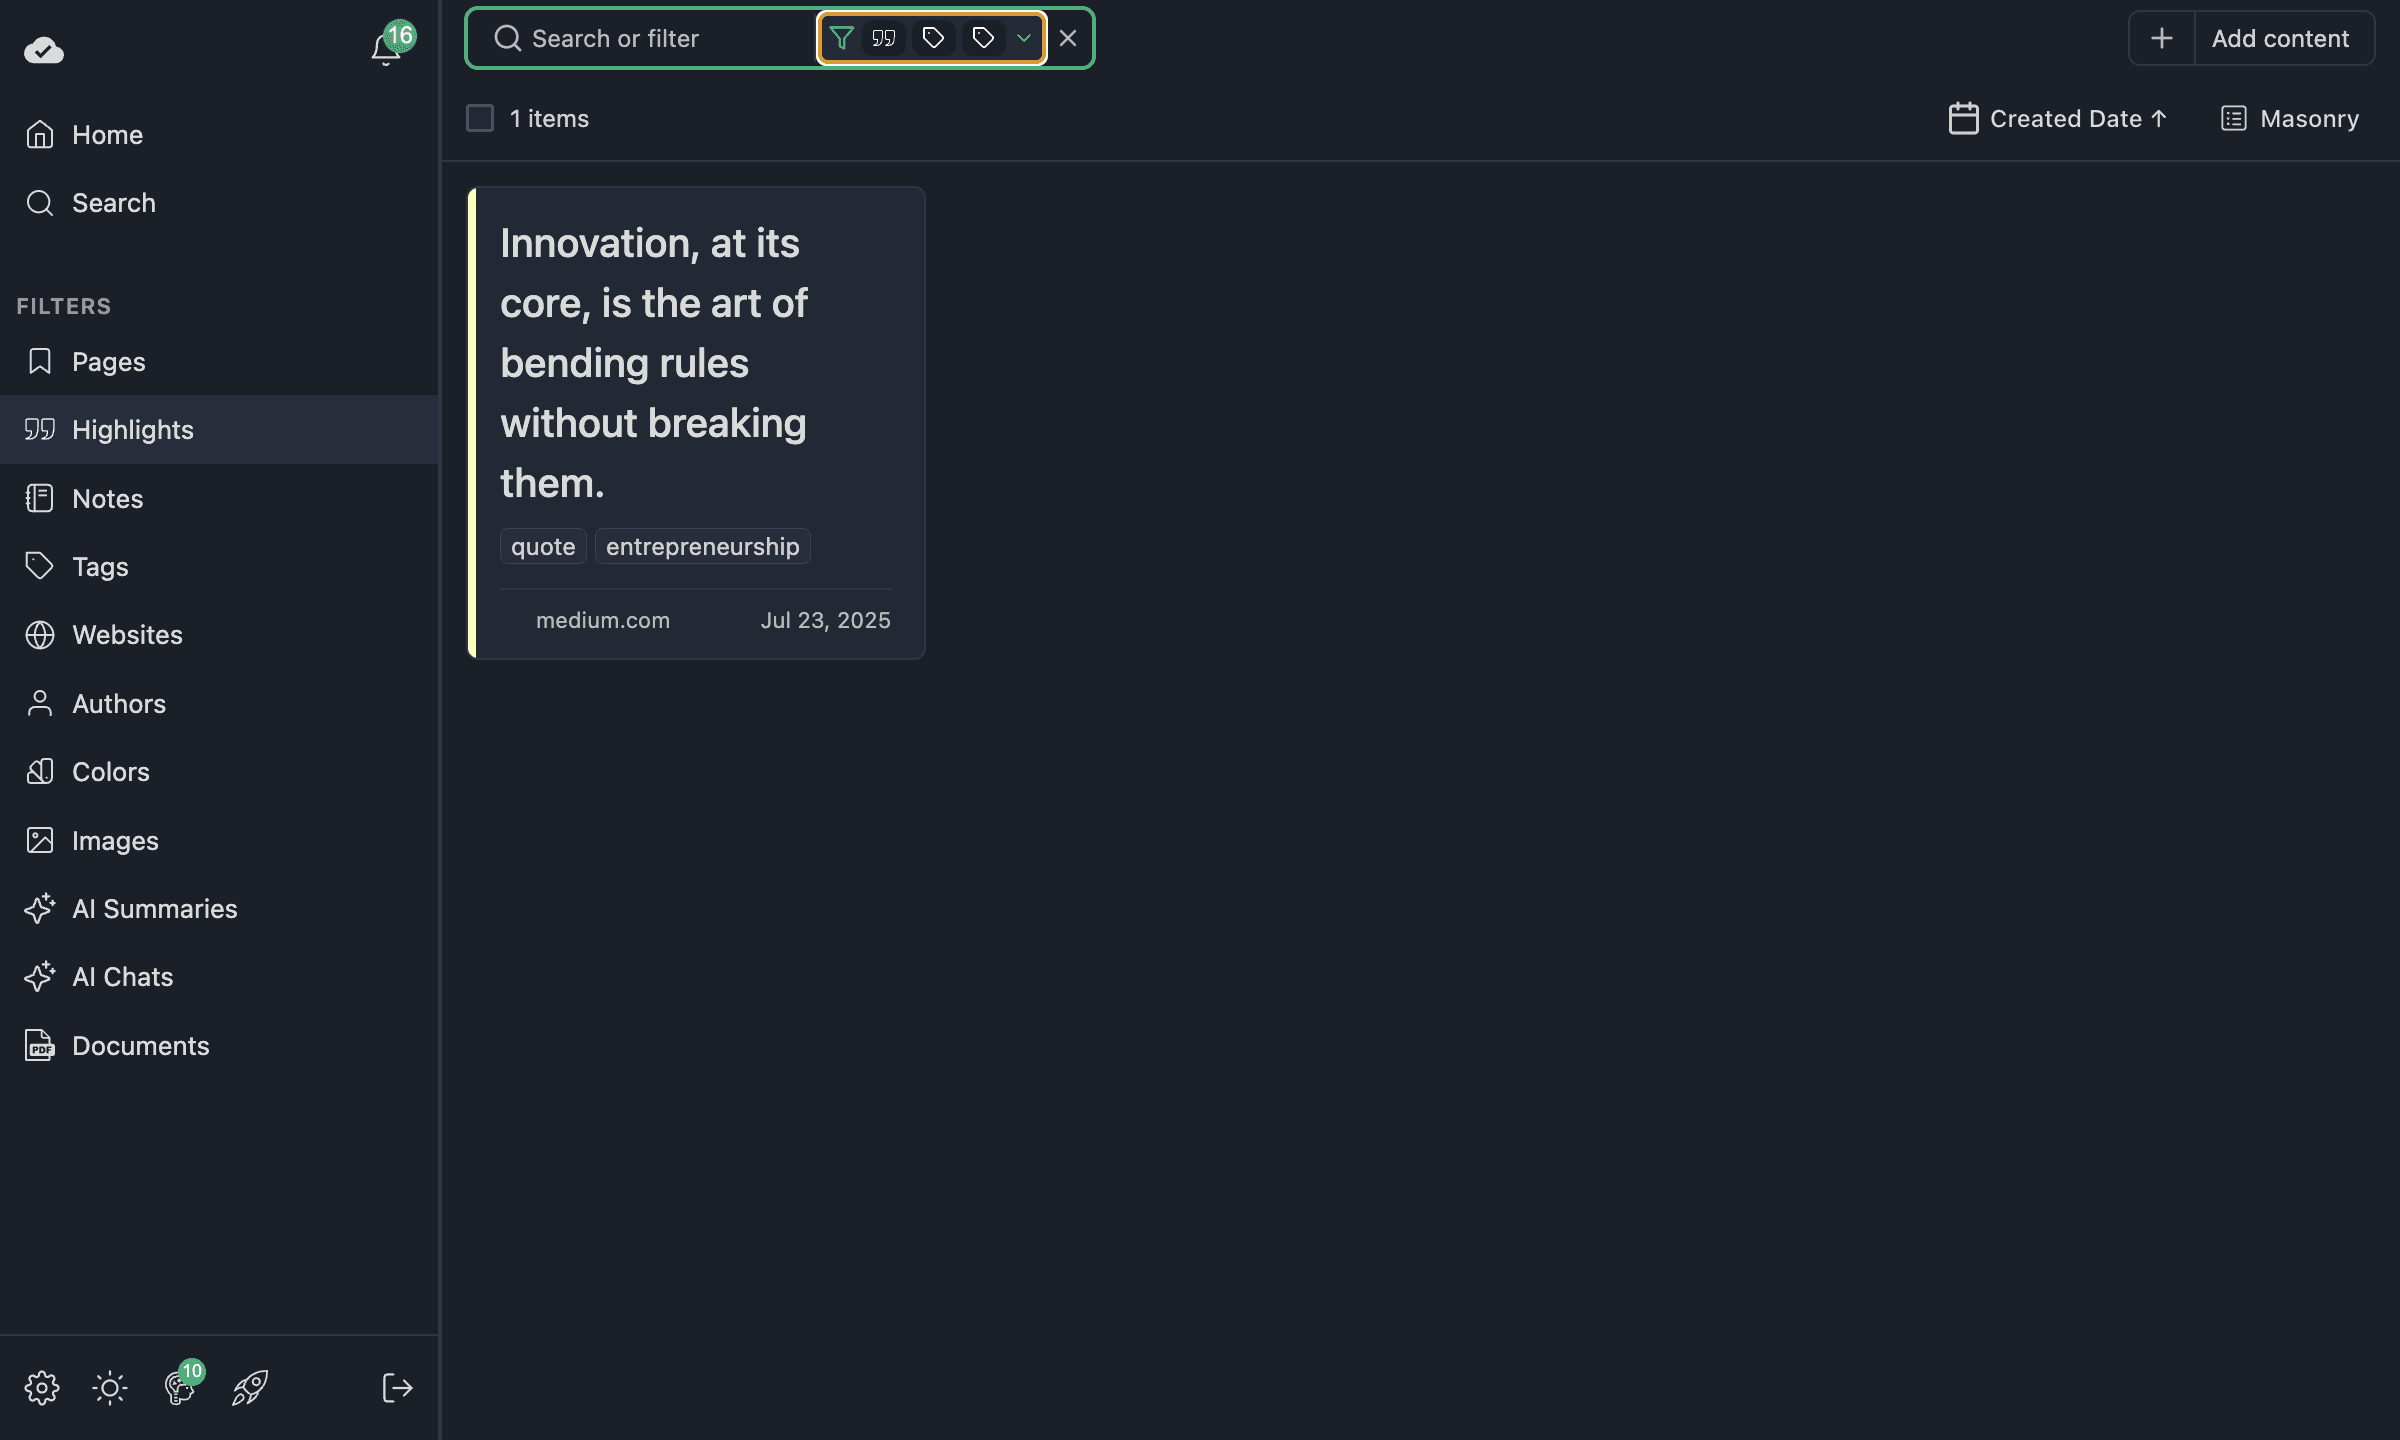
- AND — items must match all active filters. Great for narrowing down, e.g. "highlights tagged both quote and entrepreneurship."
- OR — items can match any of the active filters. Great for broadening, e.g. "highlights tagged quote or entrepreneurship."
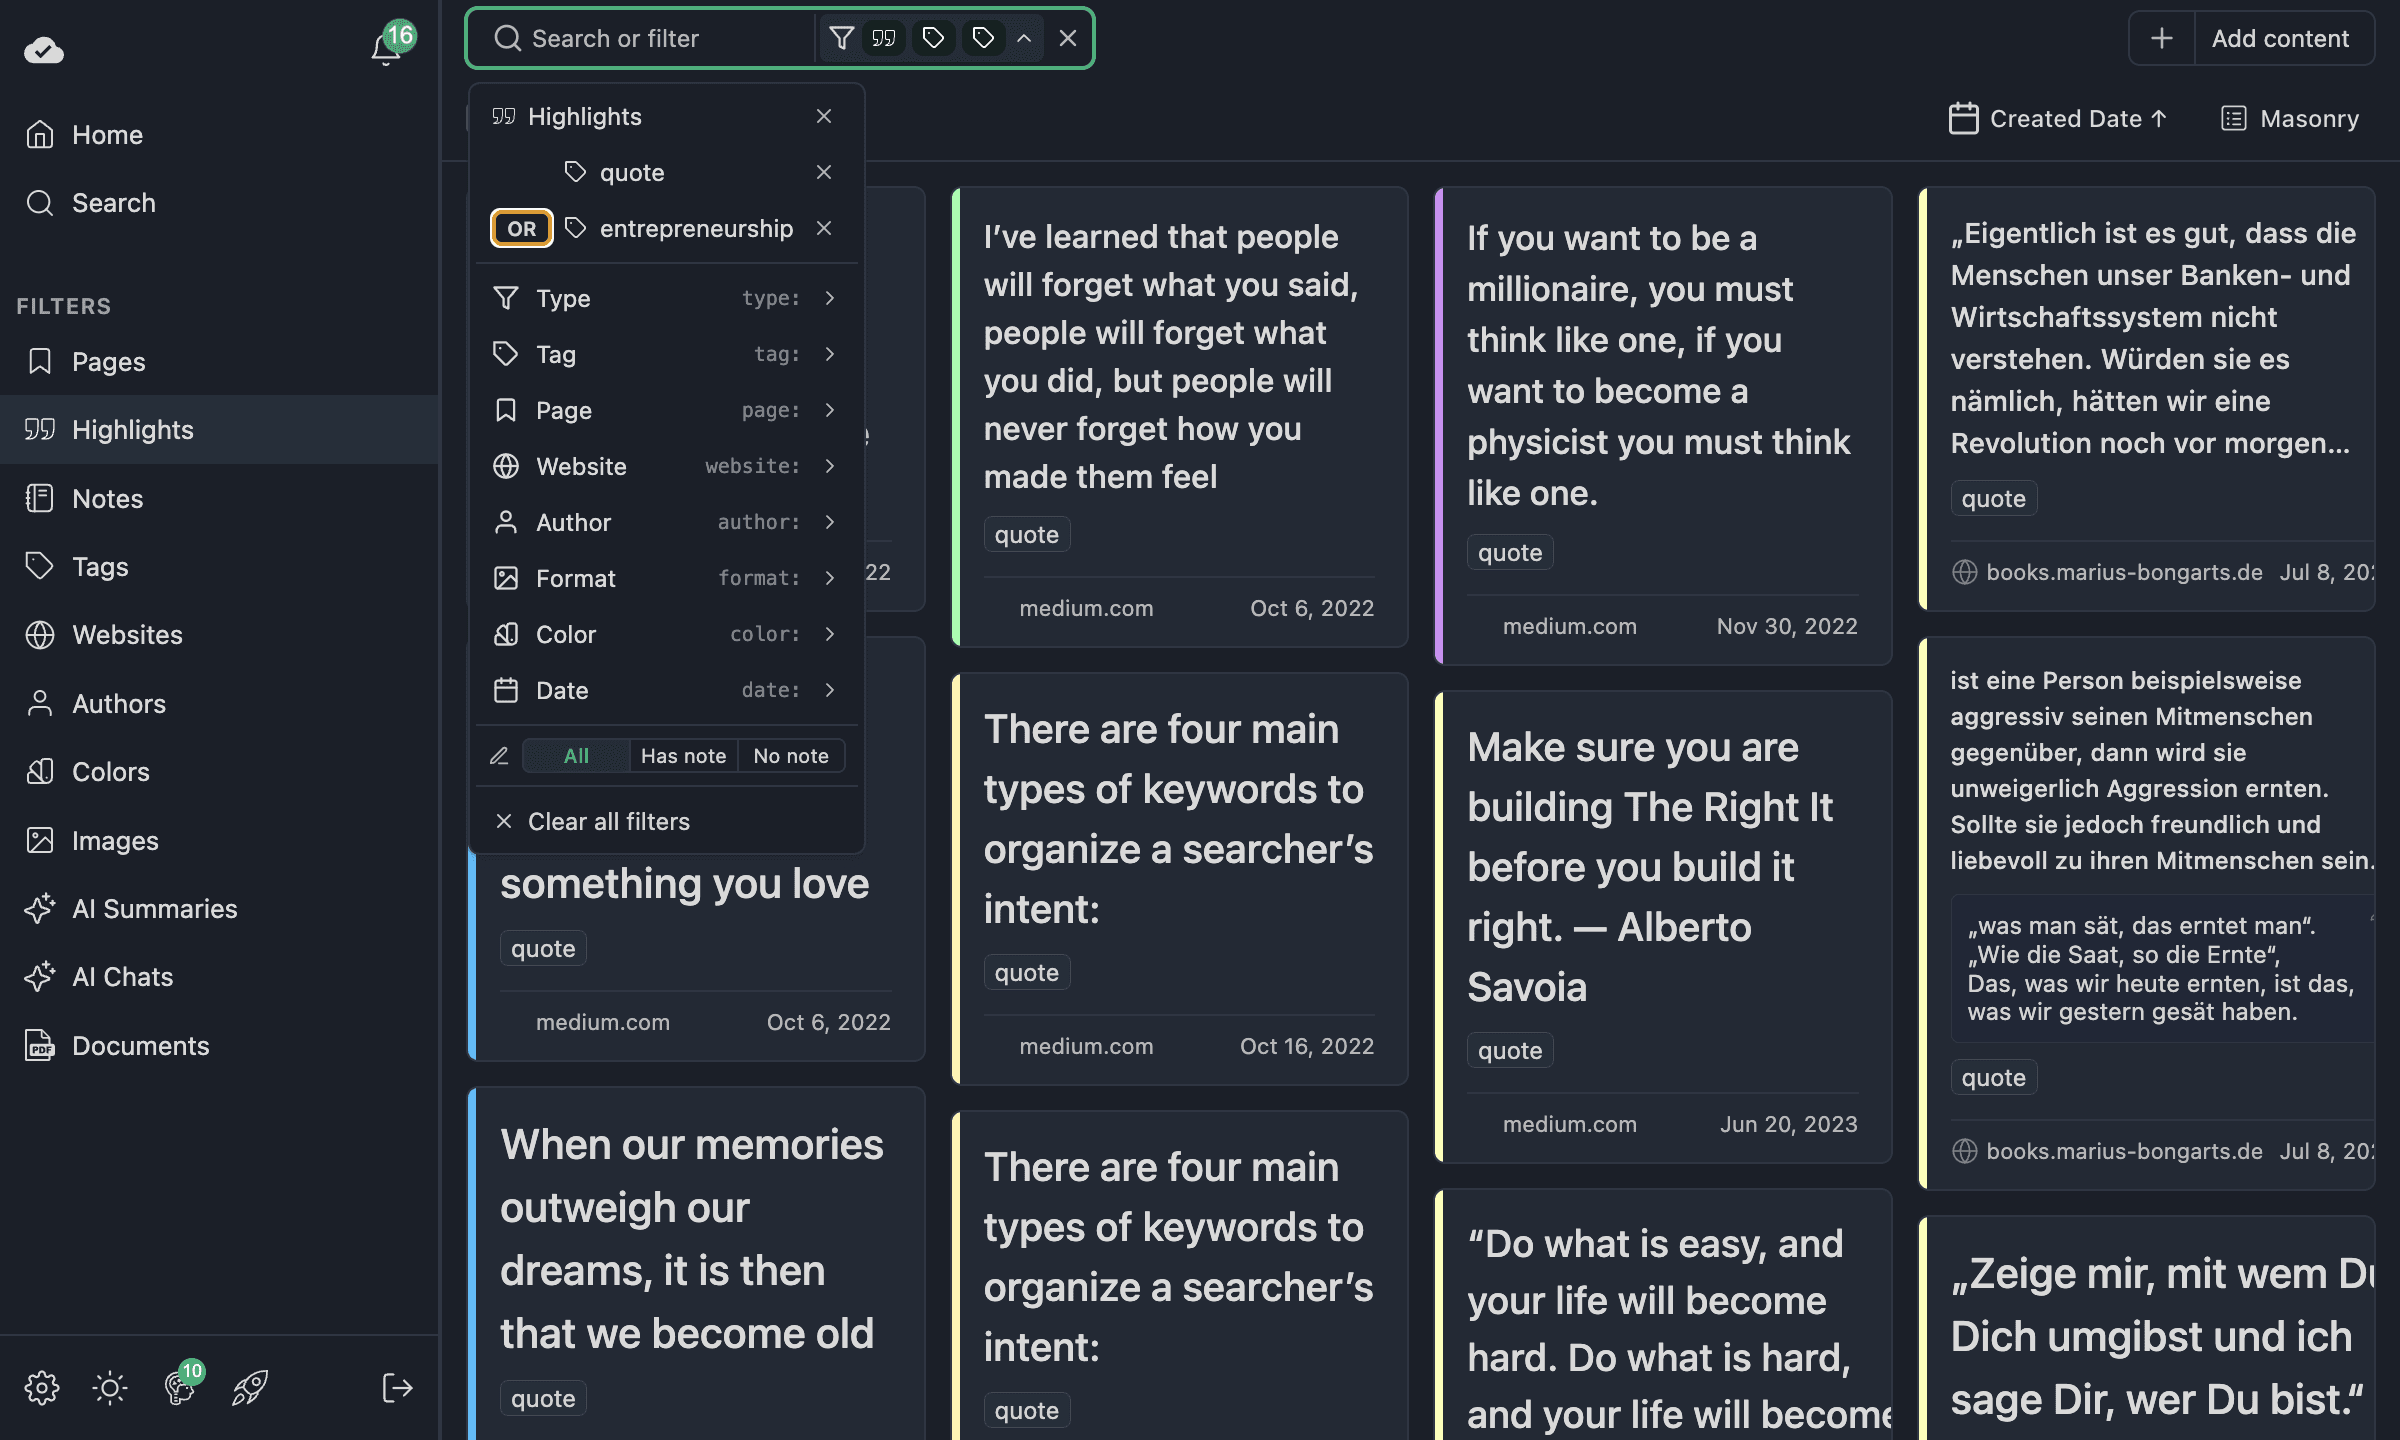
Toggle between AND and OR directly in the filter dropdown. Active filters show as badges in the toolbar so you always know what's applied.
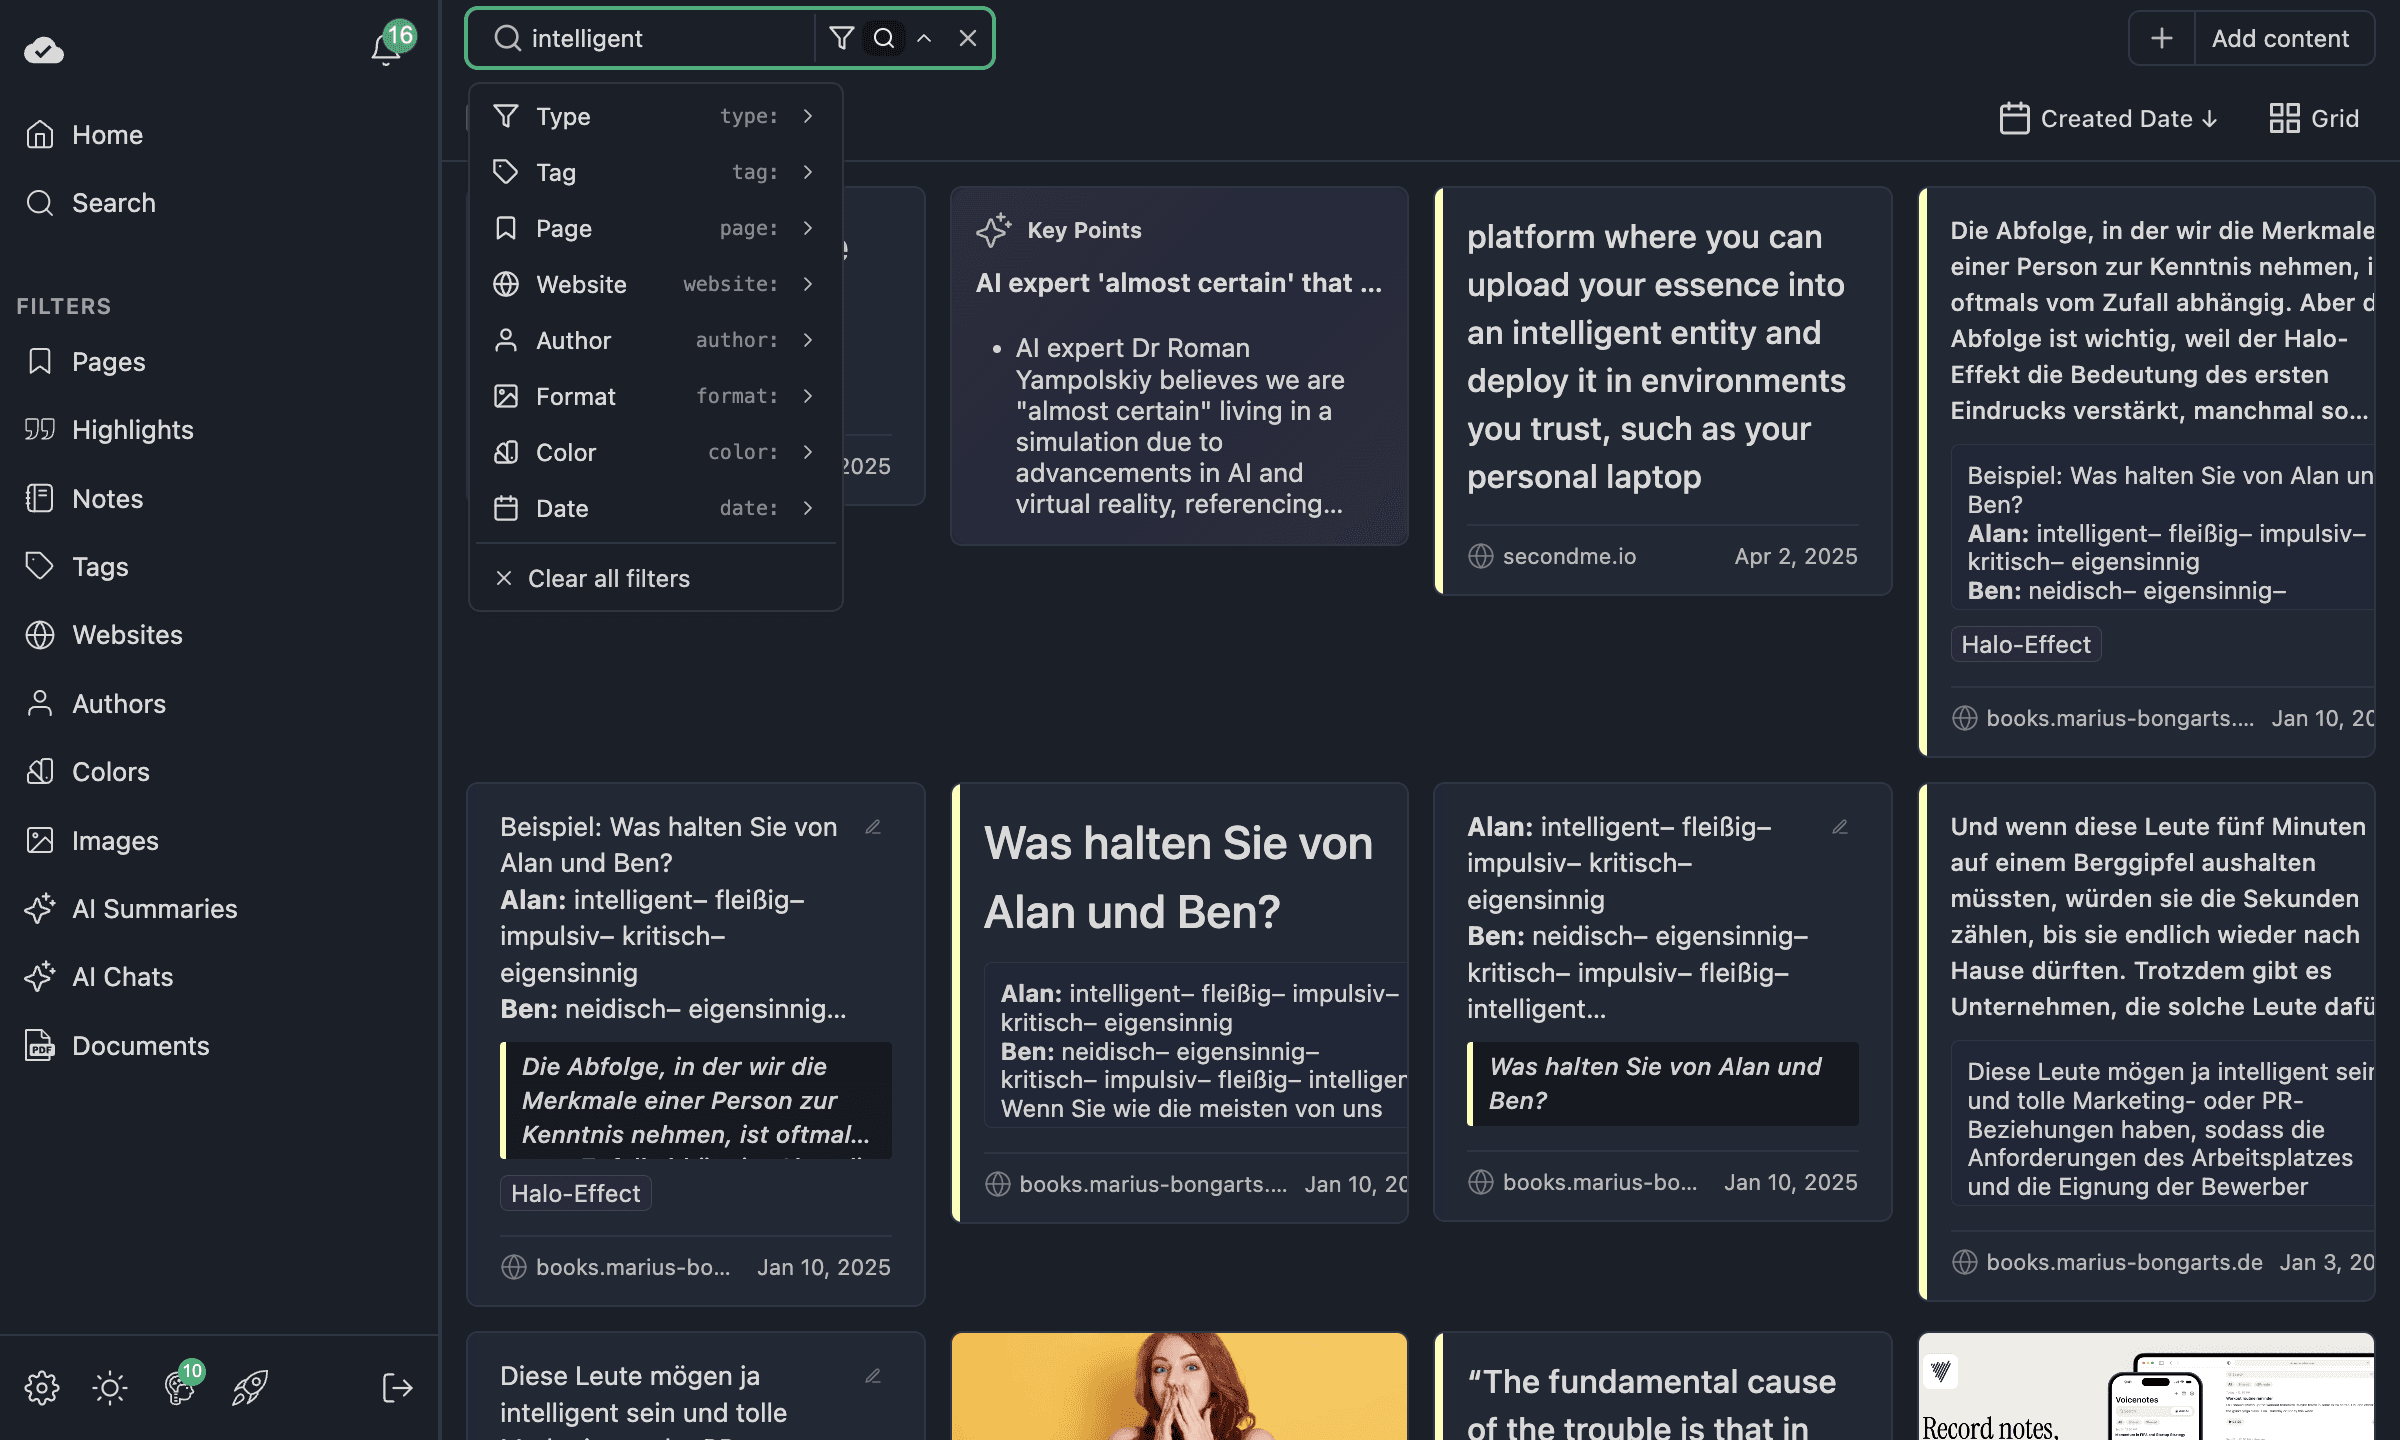
Quick Filters from the Search Bar
On supported plans, you can also add filters directly from the search input using quick syntax. For example, type tag: followed by a tag name and press Enter. This is equivalent to adding a tag filter from the filter menu.
For the full reference on filters, see Advanced Filters.
Plan requirements
Advanced filters are an Ultimate feature. In offline mode without a plan, the filter UI shows an upgrade prompt.
Multi-Select and Bulk Actions
Need to clean up your library? Multi-select makes it easy.
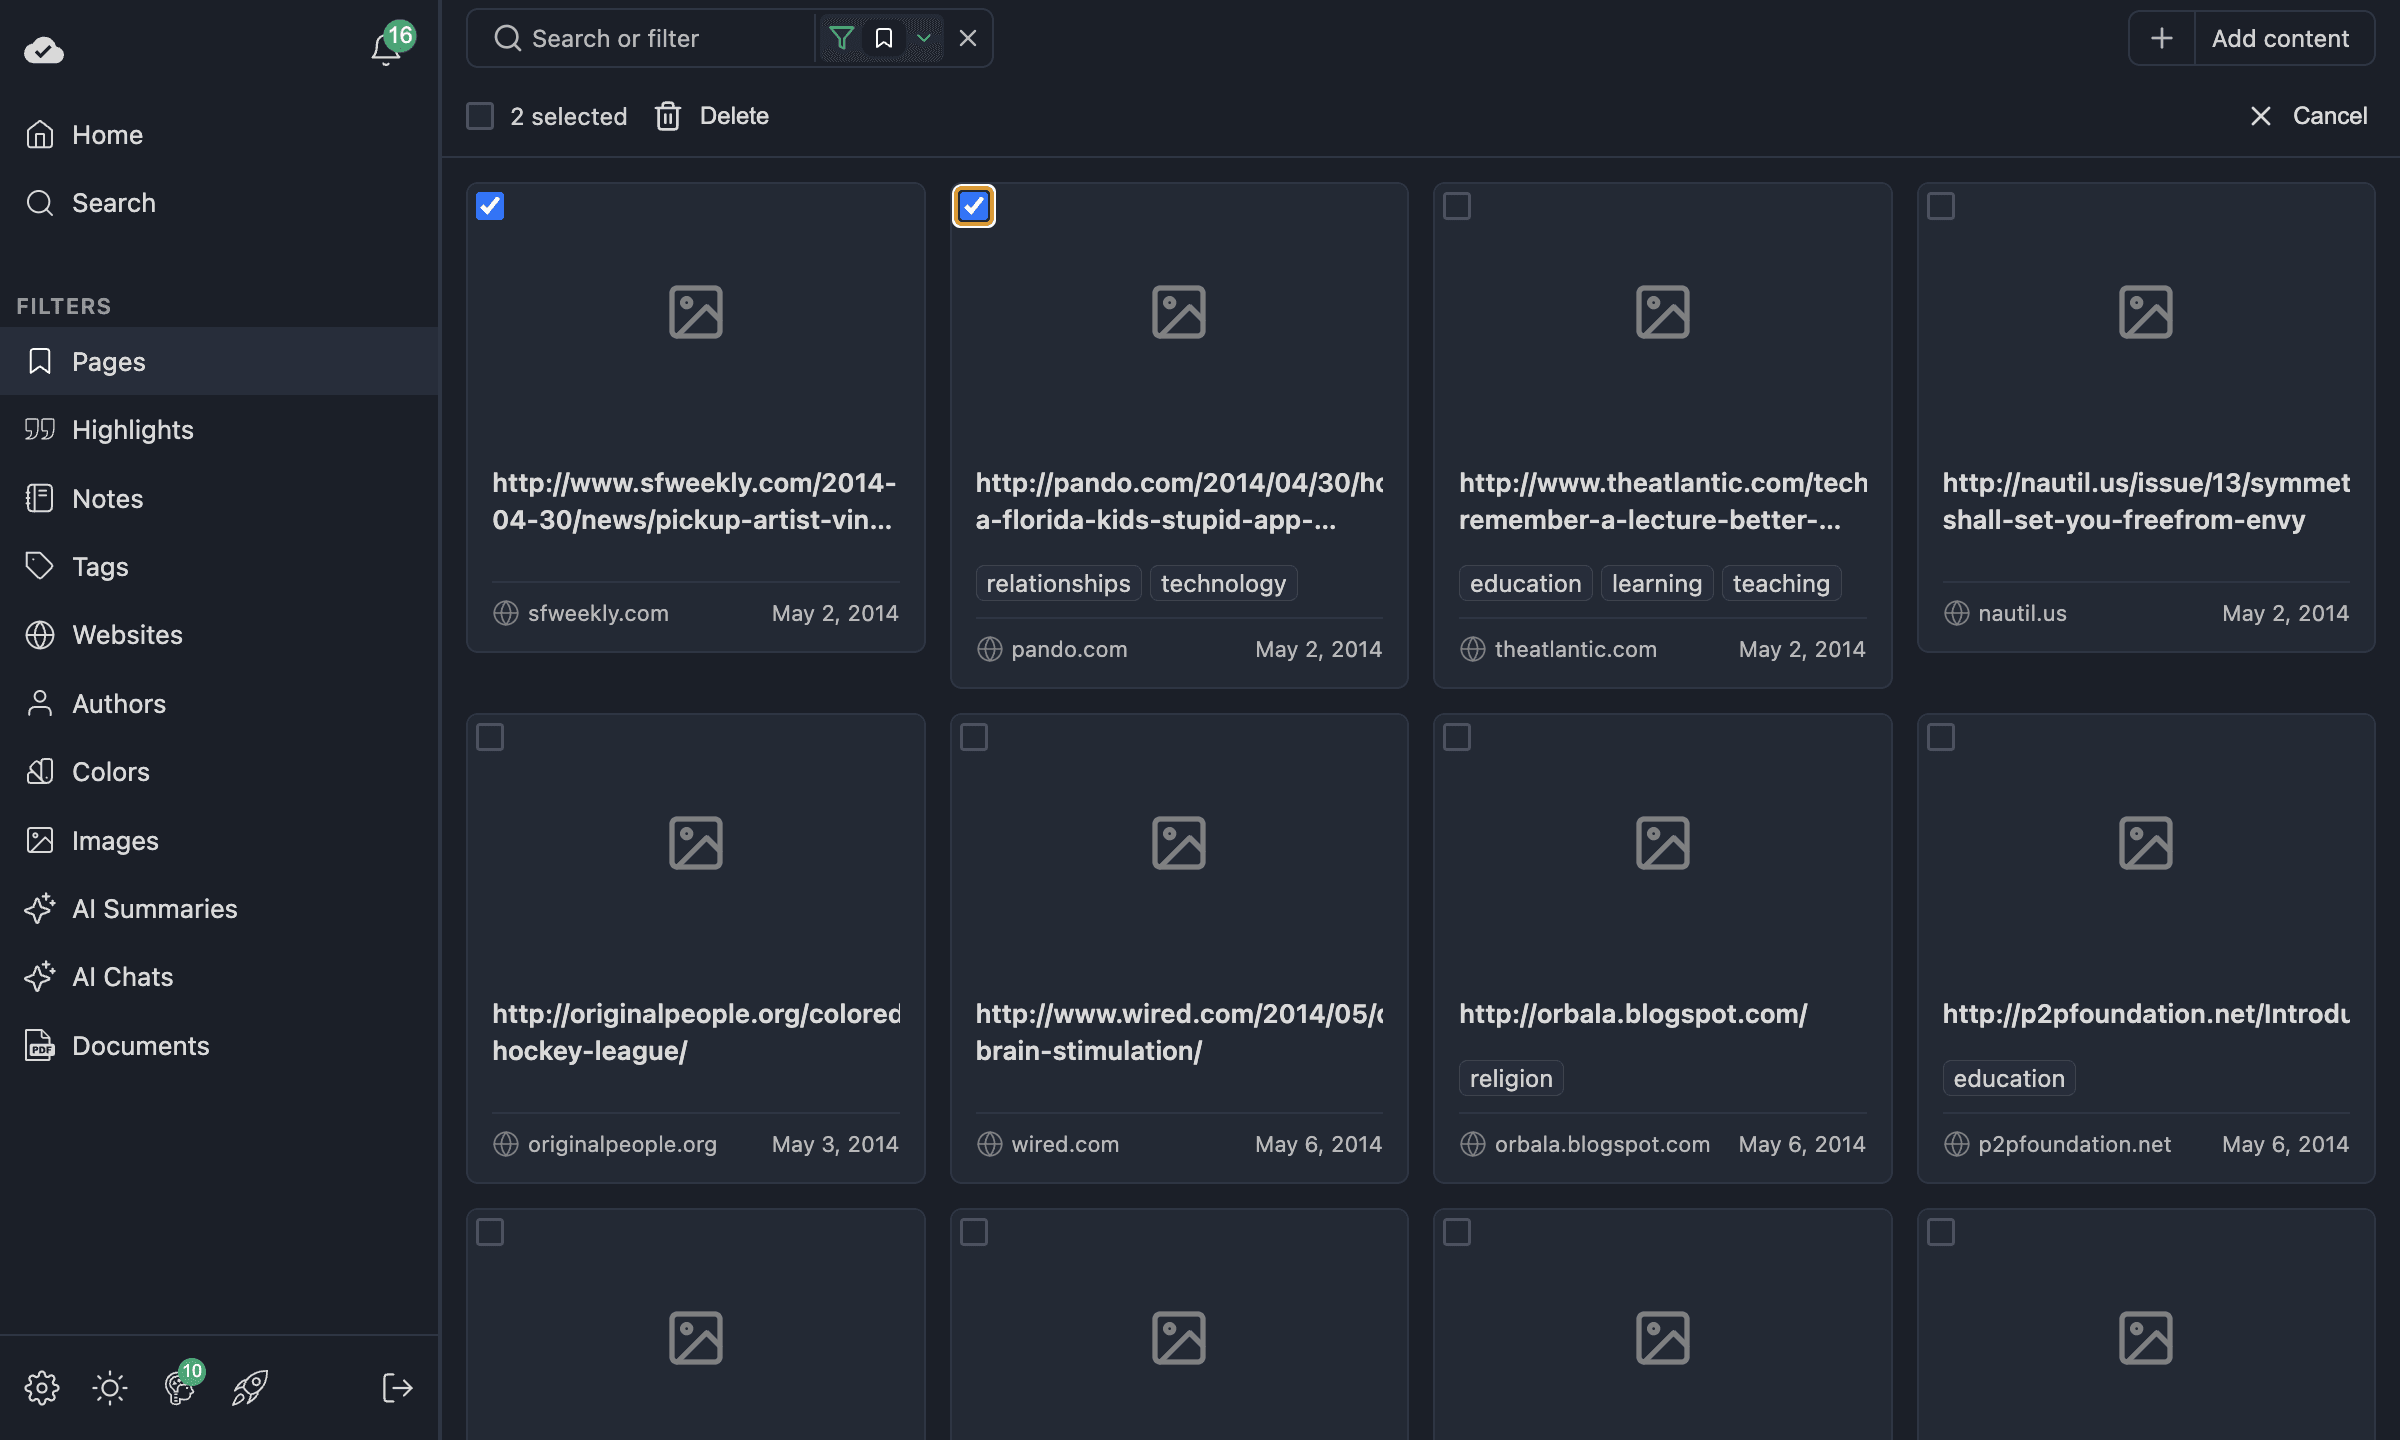
- Click the checkbox on any item to start selecting.
- Select as many items as you want — across the current view.
- Use Select All in the toolbar to select everything in the current filtered view.
- Click Delete to remove all selected items at once.
- Click Cancel to dismiss the selection without deleting.
Multi-select works in Pages, Highlights, and Notes views. Combined with filters, this is a powerful way to bulk-clean your library — for example, filter by a tag, select all, and delete everything with that tag.
Customizing Visible Fields
On Ultimate, you can control which fields are visible on each card. Open the view menu (next to the view mode selector) to toggle fields on or off.
For example, in Pages view you can hide the description or website URL to make cards more compact. In Highlights view, you can show or hide notes, tags, or the date. Your choices persist across sessions.
For the full list of toggleable fields per entity type, see Custom Visible Fields.
Infinite Scroll
All grid views load content progressively. You'll see the first batch of 20 items immediately. As you scroll down, more items load automatically — no pagination buttons, no waiting. This works seamlessly whether you have 50 items or 5,000.
View Config Persistence
Every configuration choice you make is saved automatically:
- View mode (Grid / List / Masonry) — saved per section
- Sort type and direction — saved per section
- Cover size and list width — saved per view mode
- Visible fields — saved per entity type
- Font size — saved globally
Navigate away and come back — everything stays exactly how you left it. This means you can set up Pages in Grid with large covers, Highlights in Masonry with small text, and Tags in List — each section remembers independently.
Conclusion
The dashboard transforms Web Highlights from a simple highlighter into a full research management system — all inside your browser extension. The combination of the dashboard overview, flexible grid views, advanced AND/OR filters, multi-select bulk actions, and persistent per-section configurations makes it easy to stay on top of your research, no matter how much you've saved.
Ready to Explore?
Open the extension, click the expand button, and start browsing your dashboard. If you're new to Web Highlights, install the extension and start highlighting — your dashboard will grow with every page you visit.
Related Documentation
- Web App — Grid, Search & Filters — full reference for grid behavior, filters, and visible fields
- Sidebar — extension sidebar basics
- Keyboard Shortcuts — speed up navigation
- Spaced Repetition Learning — learning mode in the app and extension